01Problem
When a drug is manufactured, chemists reach a stage where they try to find the cheapest, highest-yielding mix of chemicals to make a specific final molecule. Today that testing and iterating takes months and a lot of hard decisions, with very little technology helping. Aether uses robotics and data modeling to shorten that timeline, make projects and data easier to manage, and save millions of dollars.
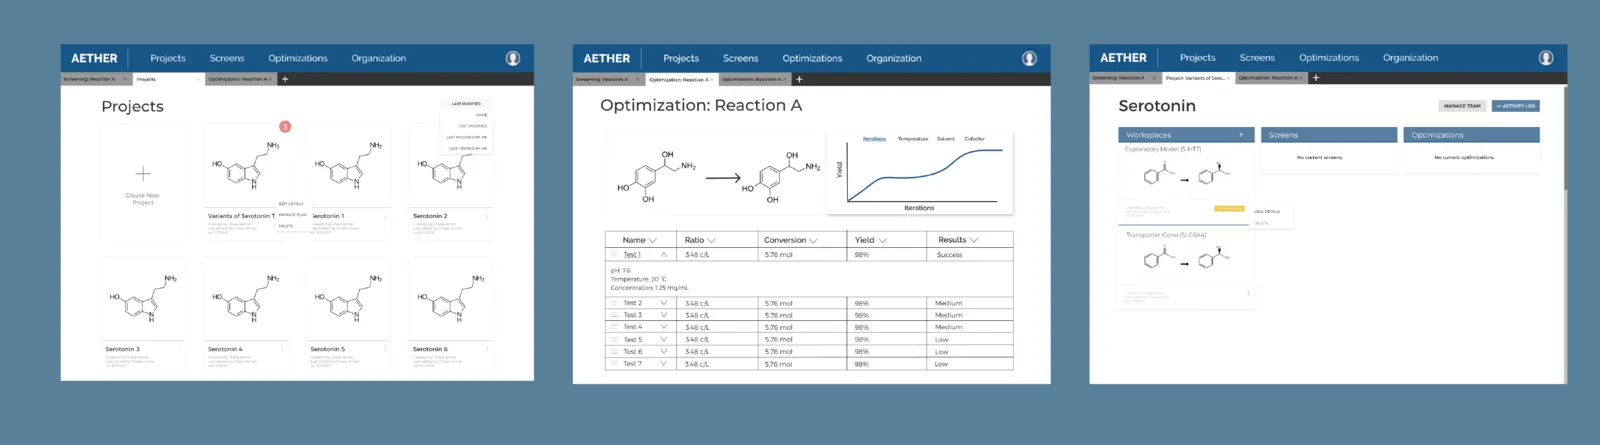
Goal: our team of four designers was asked to design the interface for Aether’s web app, where process chemists would use Aether’s service to find enzymes that shorten how long it takes to synthesize a molecule.
02User research
First we had to understand how Aether’s technology works. We met with our client several times to learn about chemistry, robotic testing and how machine learning applies to their use cases. There was a lot to learn, and we asked a lot of questions before we even started user research.
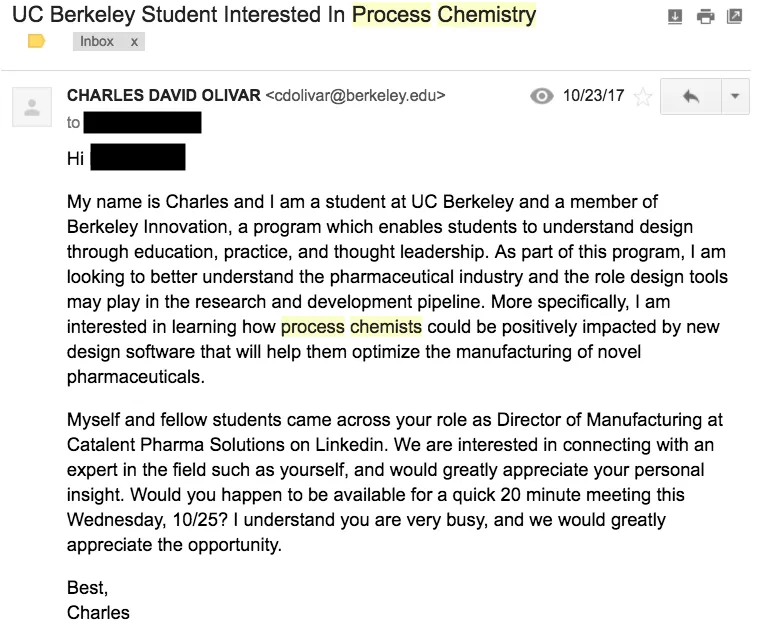
Then we realized we had no users to interview. Our client couldn’t give us any, and we had no easy way to reach our audience: PhDs in organic chemistry working as process chemists in the pharmaceutical industry. So we scraped LinkedIn for 300+ emails and asked for phone interviews.
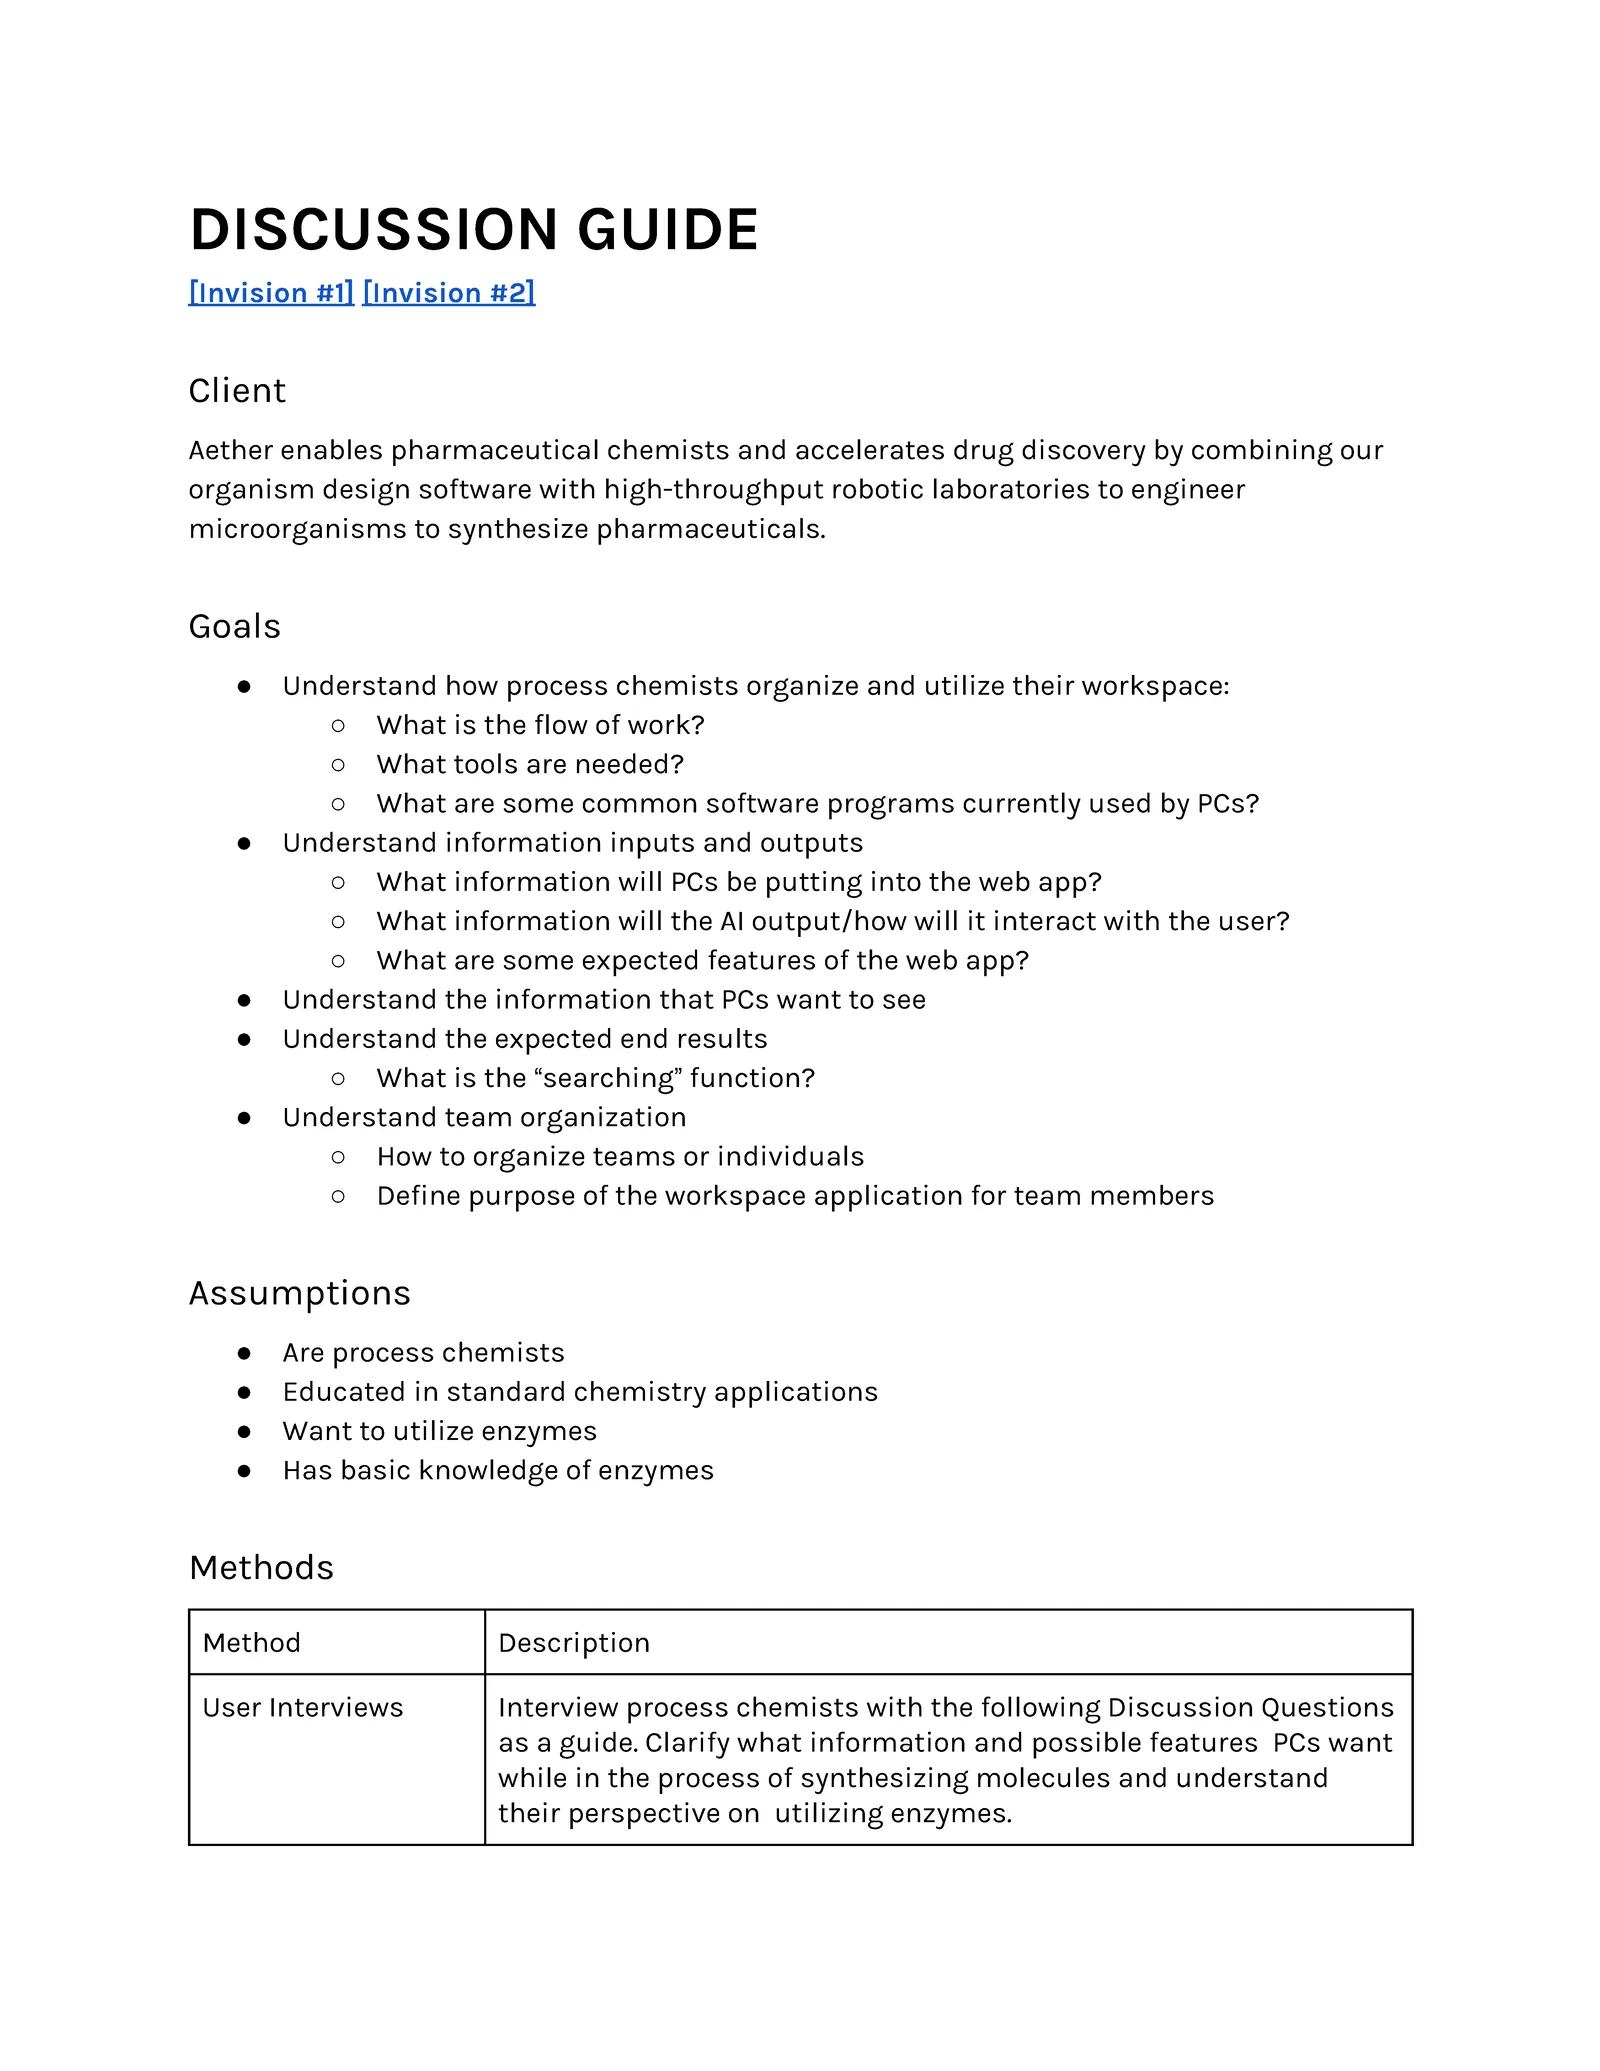
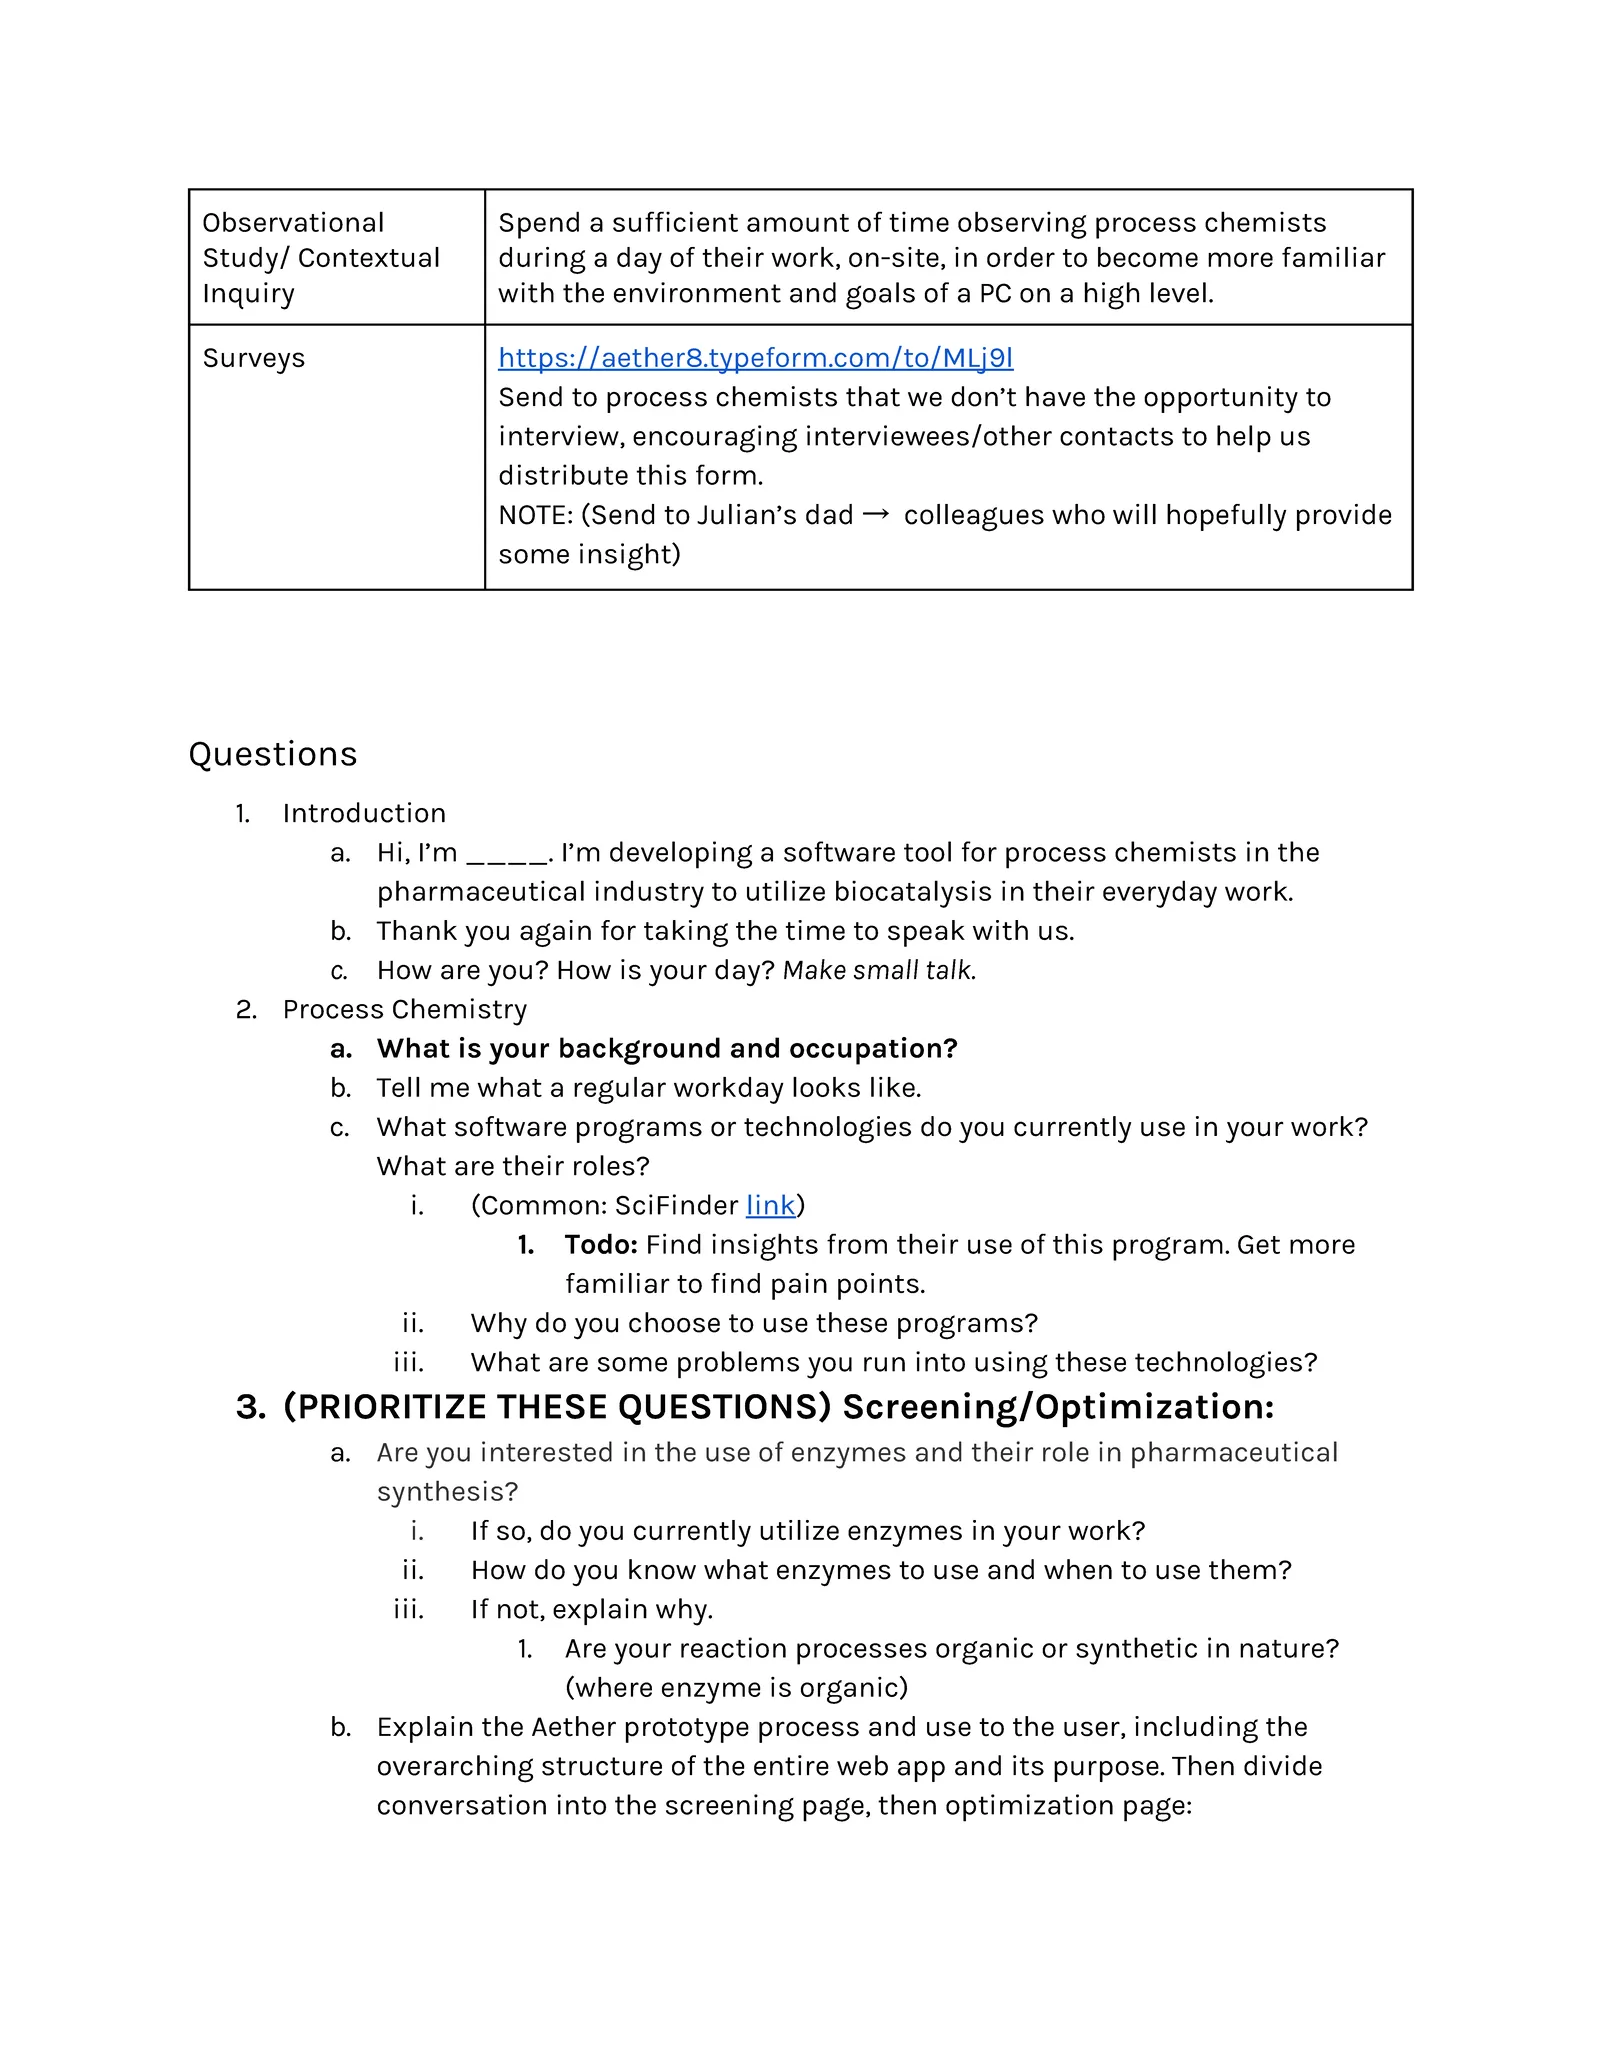
We interviewed process chemists to get a picture of their daily workflow and find pain points. None of us are chemists, so we were especially curious what data they’d expect to put into a service like this and get back out.
03Insights
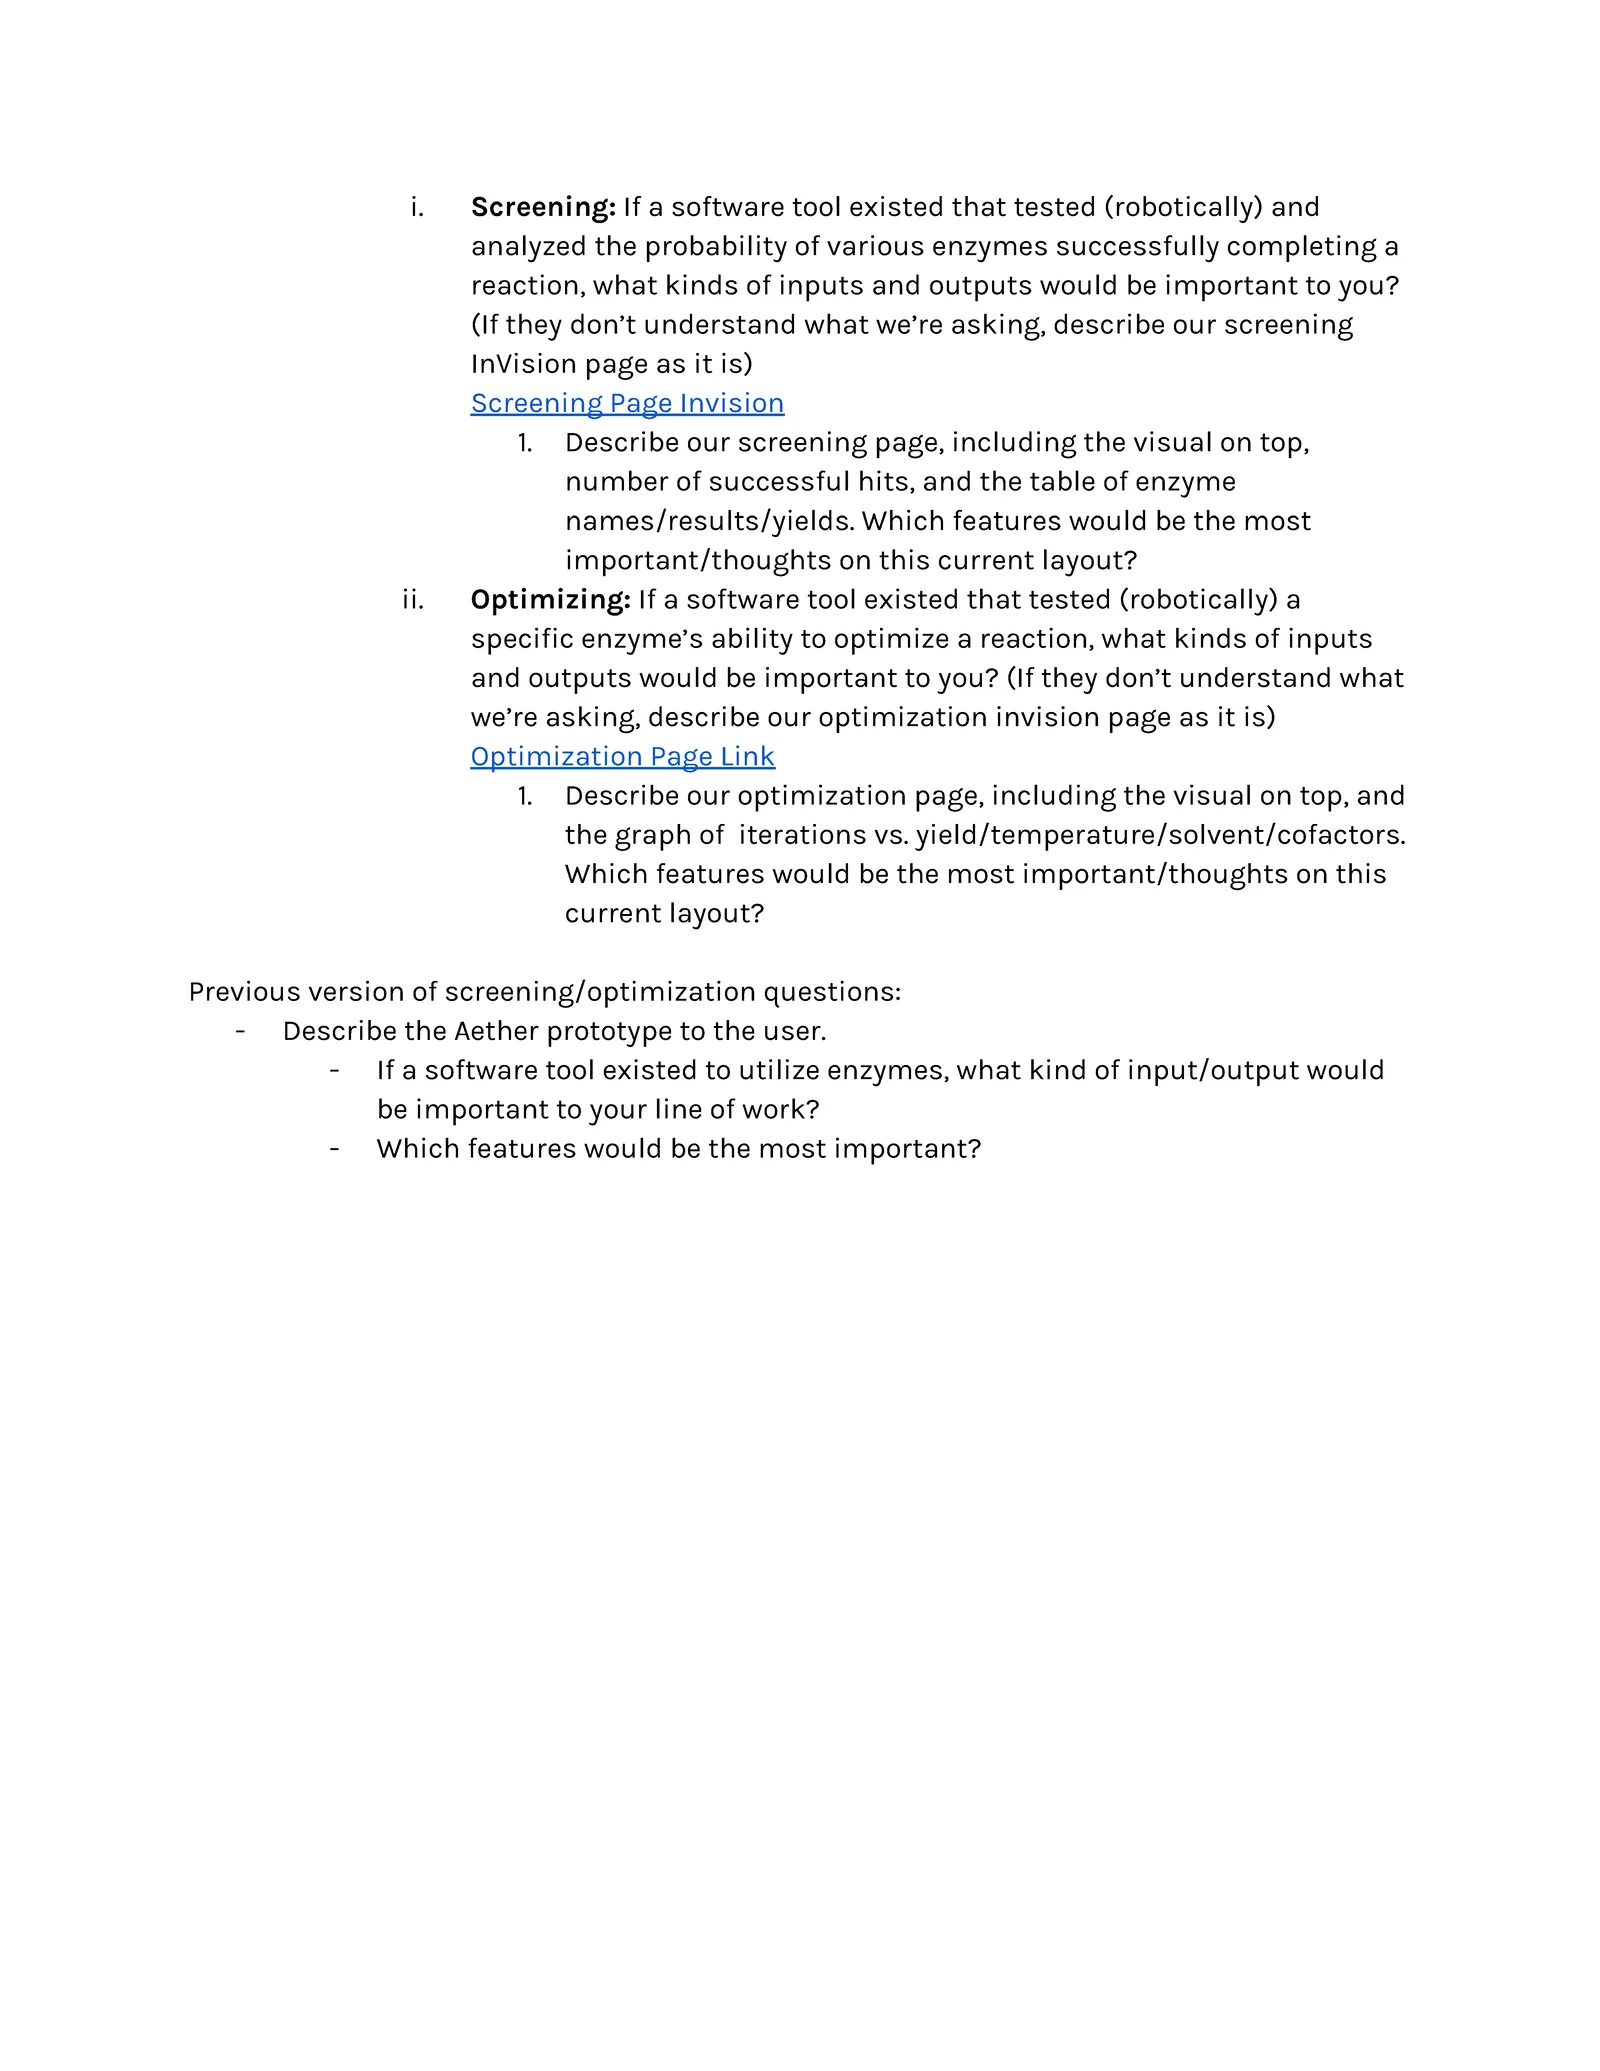
We did phone interviews with several chemists and heard some quotes worth keeping:
- “There is a lot of skepticism in predictive software. Chemists want to see the justification and decision-making process on how the predictions add up.”
- “I usually keep track of data by writing it down in my notebooks.”
- “I would want more information about how enzymes work in biocatalysis because it is not as accessible at the moment.”
Our key takeaways:
- They’re skeptical of predictive software, and worried about the security of their work.
- They mostly use physical notebooks or the Microsoft suite to track data.
- They identify molecules visually more than by name.
- They prefer a simple but technical layout, nothing cluttered or confusing.
- They want a web app that can adapt to their company.
We also came away with a list of the data they wanted or expected to see:
- Ratio
- Conversion in mols
- Yield
- Iteration
- Temperature
- Solvent
- Cofactor
04Ideation
We started with a general user flow, then split up to brainstorm rough wireframes on our own. After that we got back together with our client, talked through the ideas, kept what worked, dropped what didn’t, and got feedback on what to add.
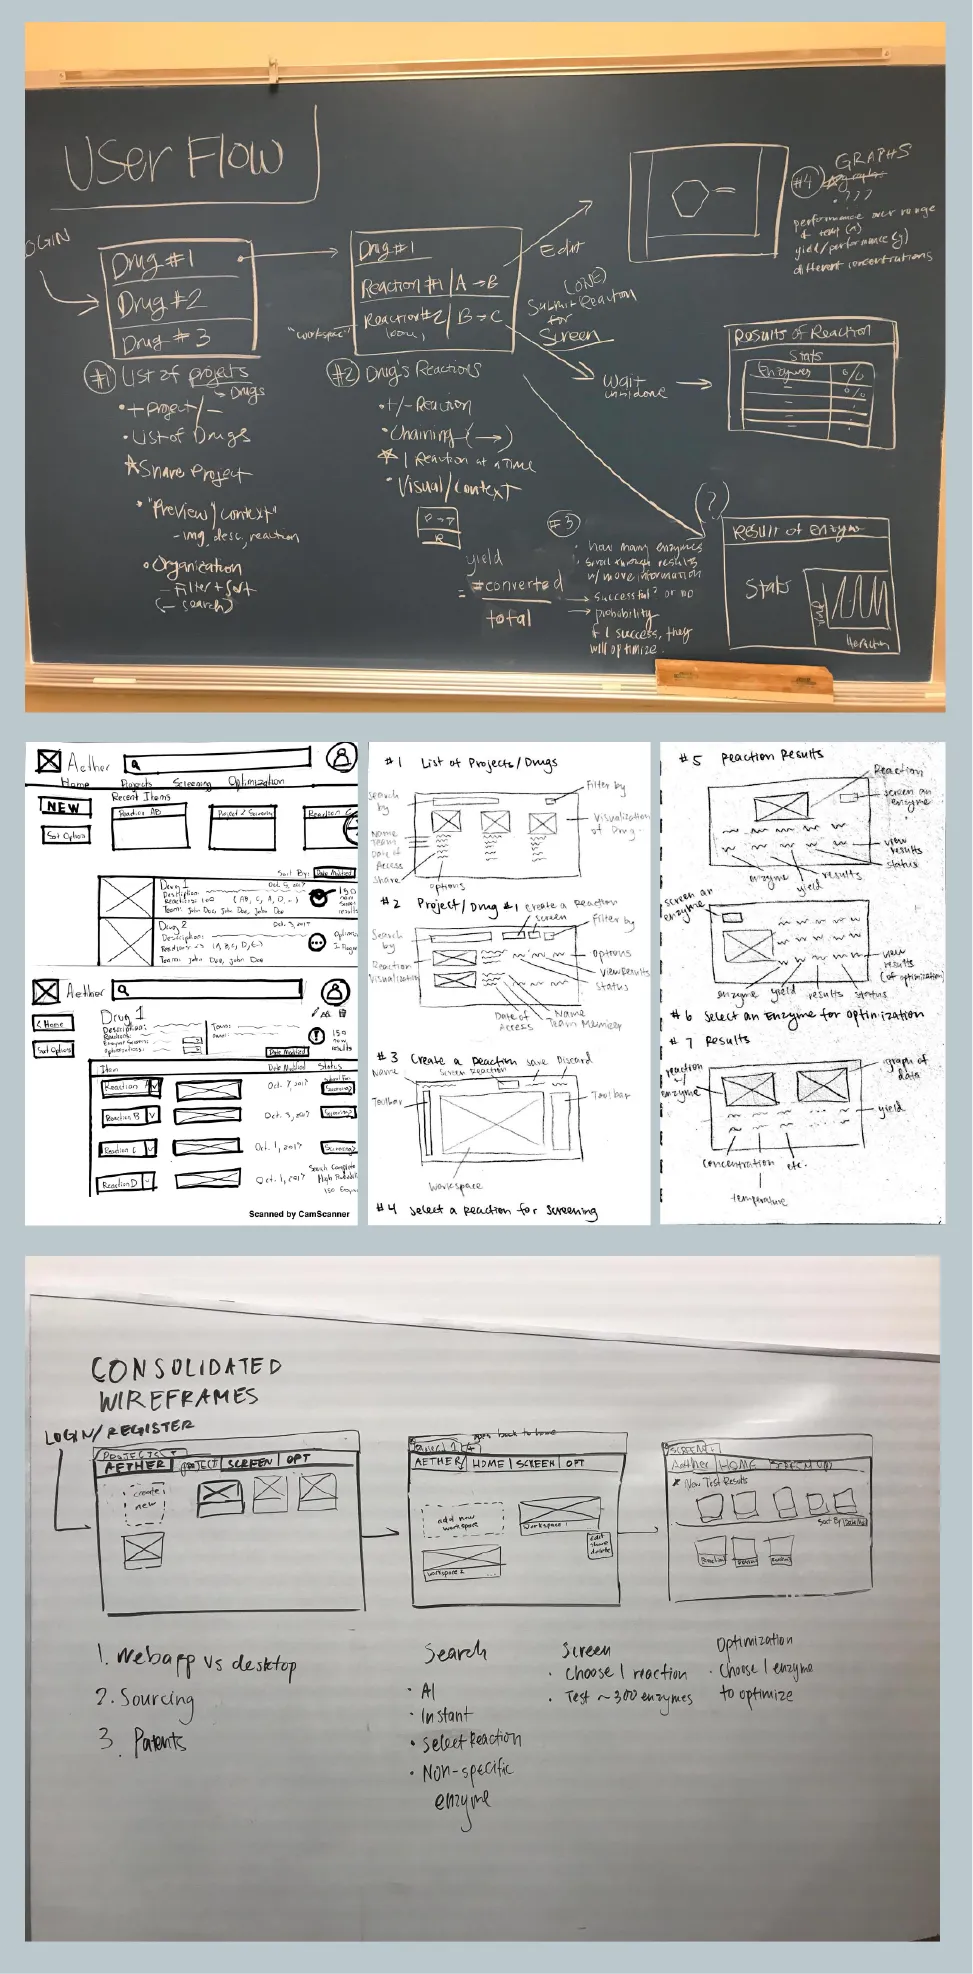
Our main goal was to let chemists compare the results of different tests easily, which led us to tabs. We also went back and forth on how to organize data and projects, from folders with tags to a cascading sidebar.
05Mid-fidelity
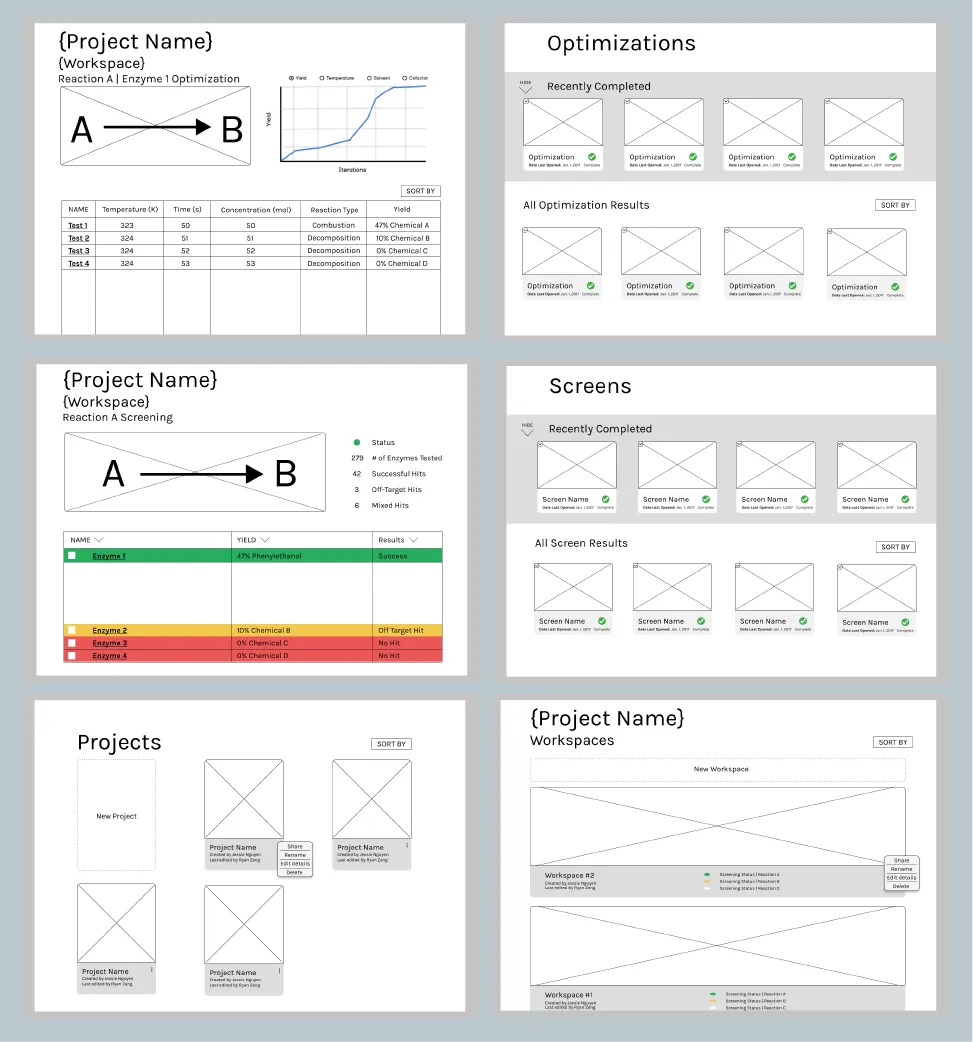
We took our sketches into Figma. We ended up with cards, with workspaces, screens and optimizations built into each project.
06Final screens
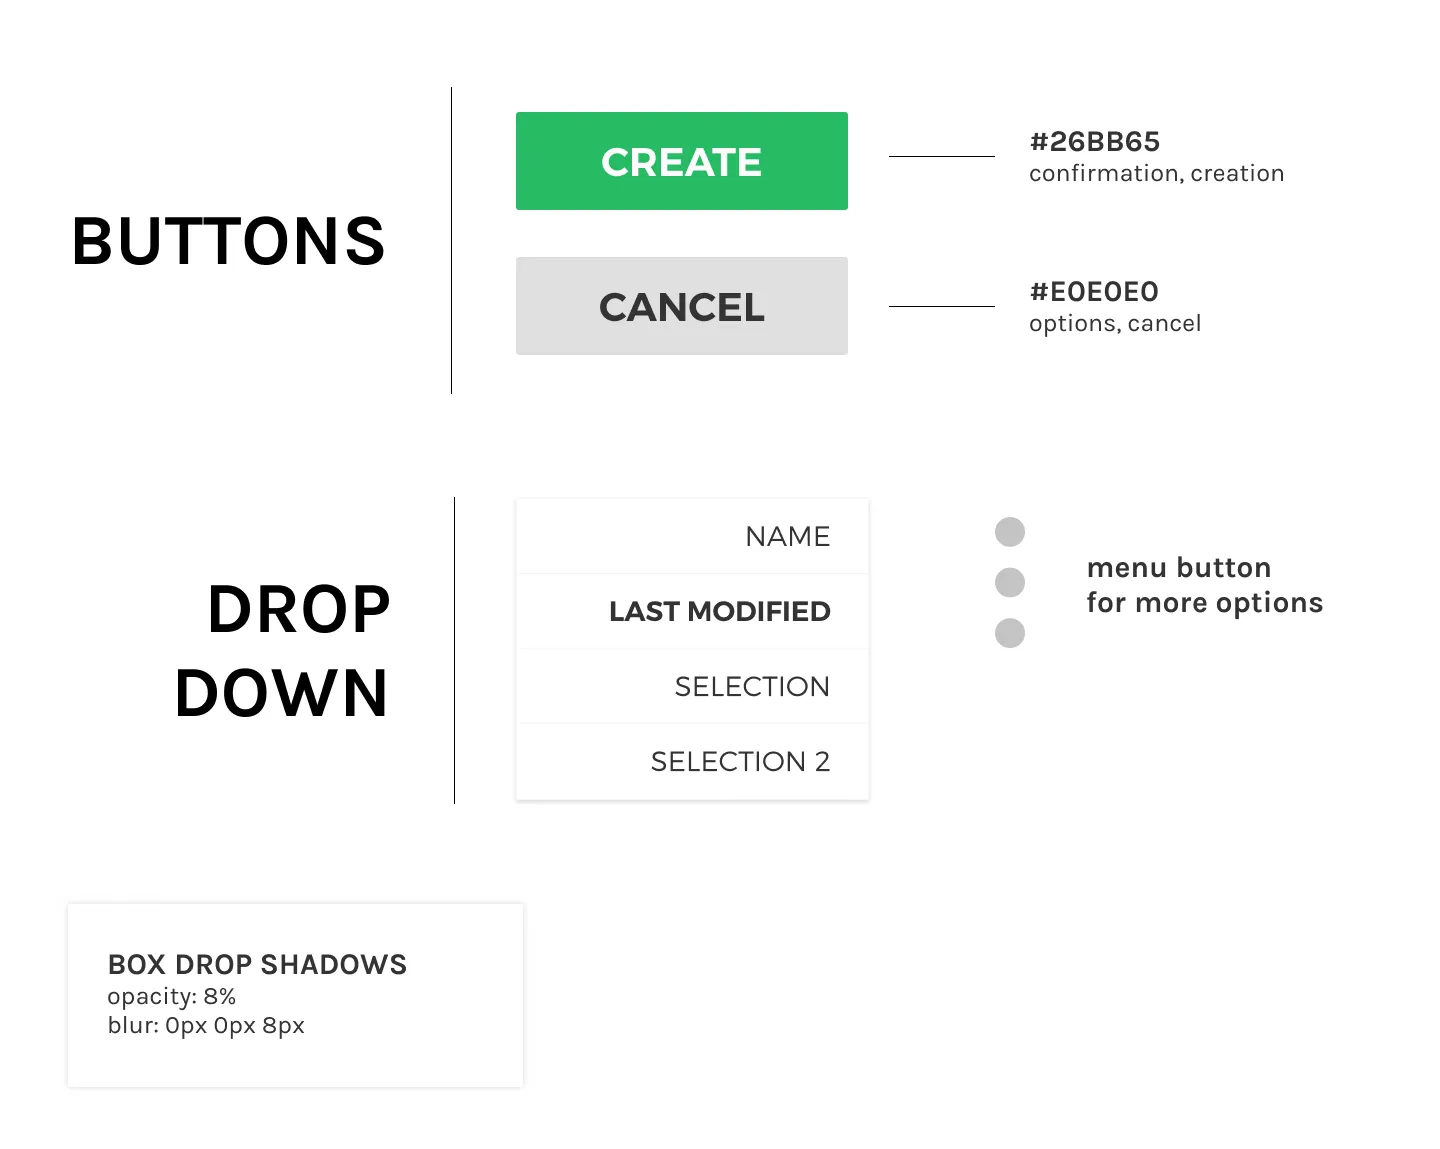
First, the style guide.
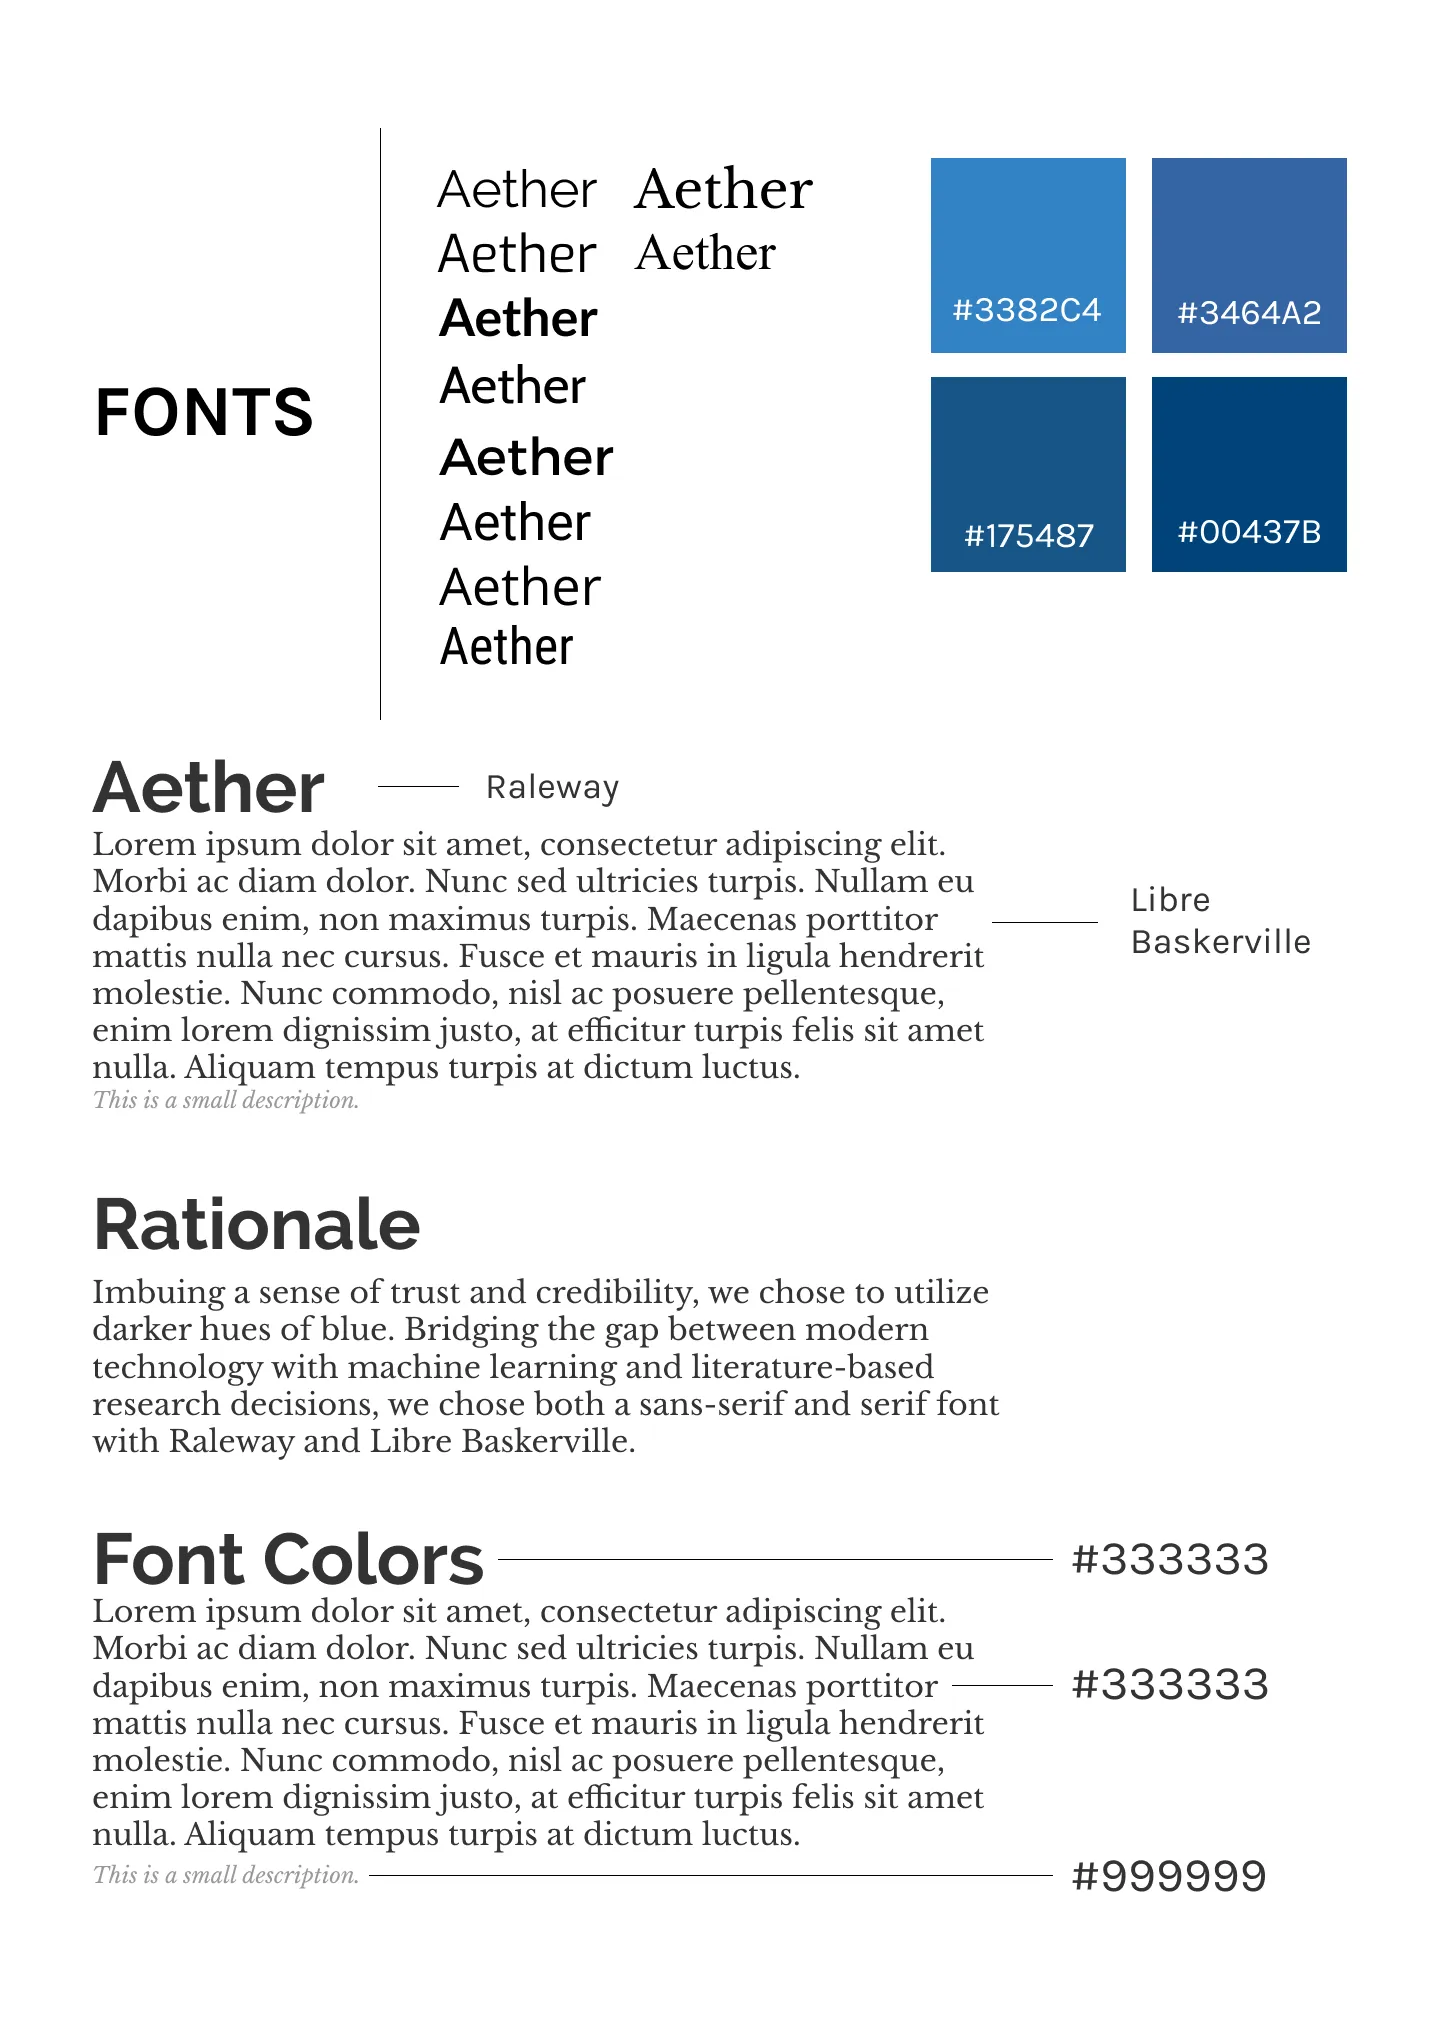
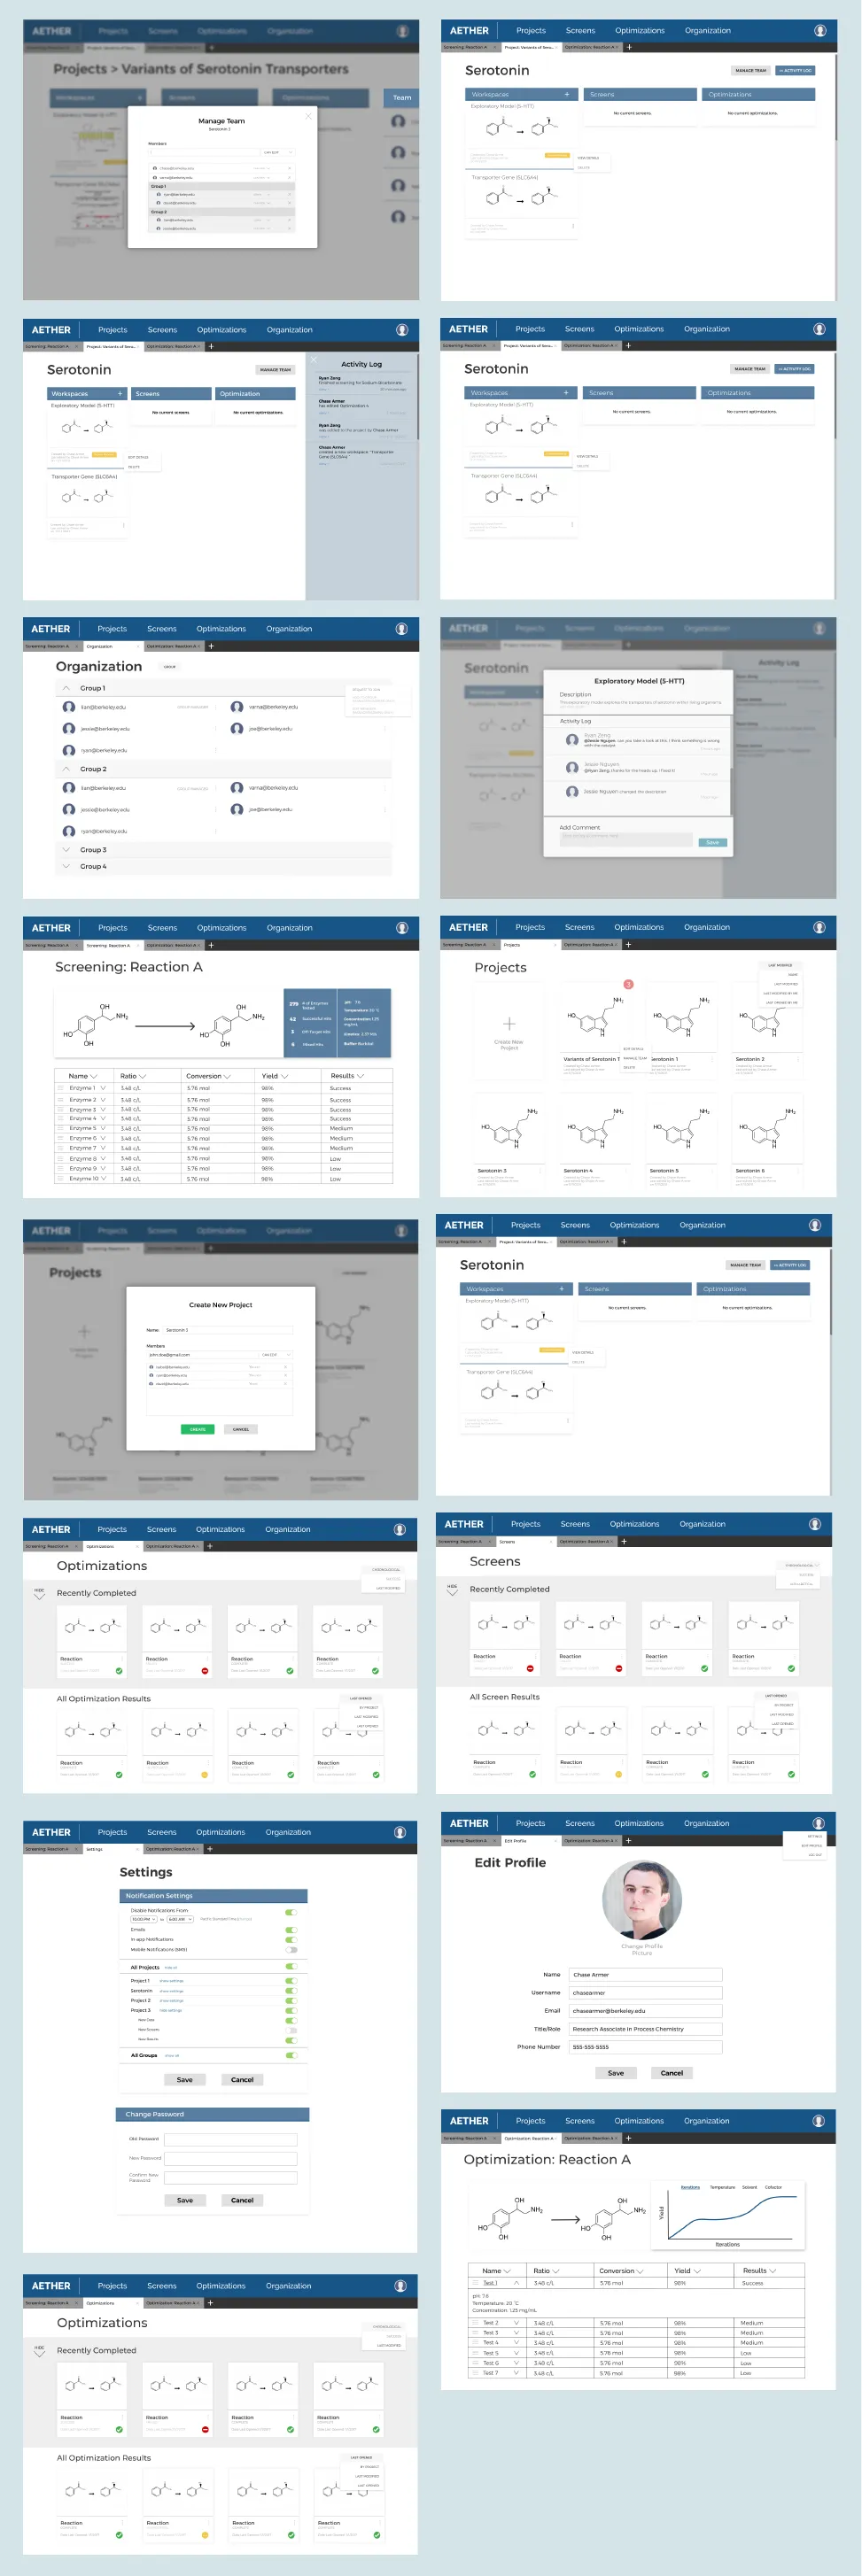
In the high-fidelity screens we fleshed out each project with a dashboard and an activity log, plus a description and comments. We also added an organization space for common project groupings and for managing teams, aimed at a company’s administrators.
07Next steps
The semester ended and our deliverables were due, so we didn’t get to user test. Aether plans to show a prototype built from our final designs at a process chemistry conference, and to run user testing themselves.
08Takeaways
Know what you don’t know
We had no chemistry background, so we asked our client what we needed to understand. It also meant working out the right questions to ask users.
It’s okay to go off-script if the information is relevant
Aether’s CEO joined some of our interviews to bridge our lack of technical knowledge. Now and then he followed up on something a chemist said, and it surfaced things we never would have found with our original discussion guide.