Design / SkyAlert

Case study 02

SkyAlert

The first seismic prevention app. We designed the onboarding that explains what it does and what the subscription options are.

Role
Designer
Client
SkyAlert, via Berkeley Innovation
Worked with
Three other designers: Monica, Warren and Bhushan
Tools
Figma, Trello, InVision, UserTesting.com, Google Forms
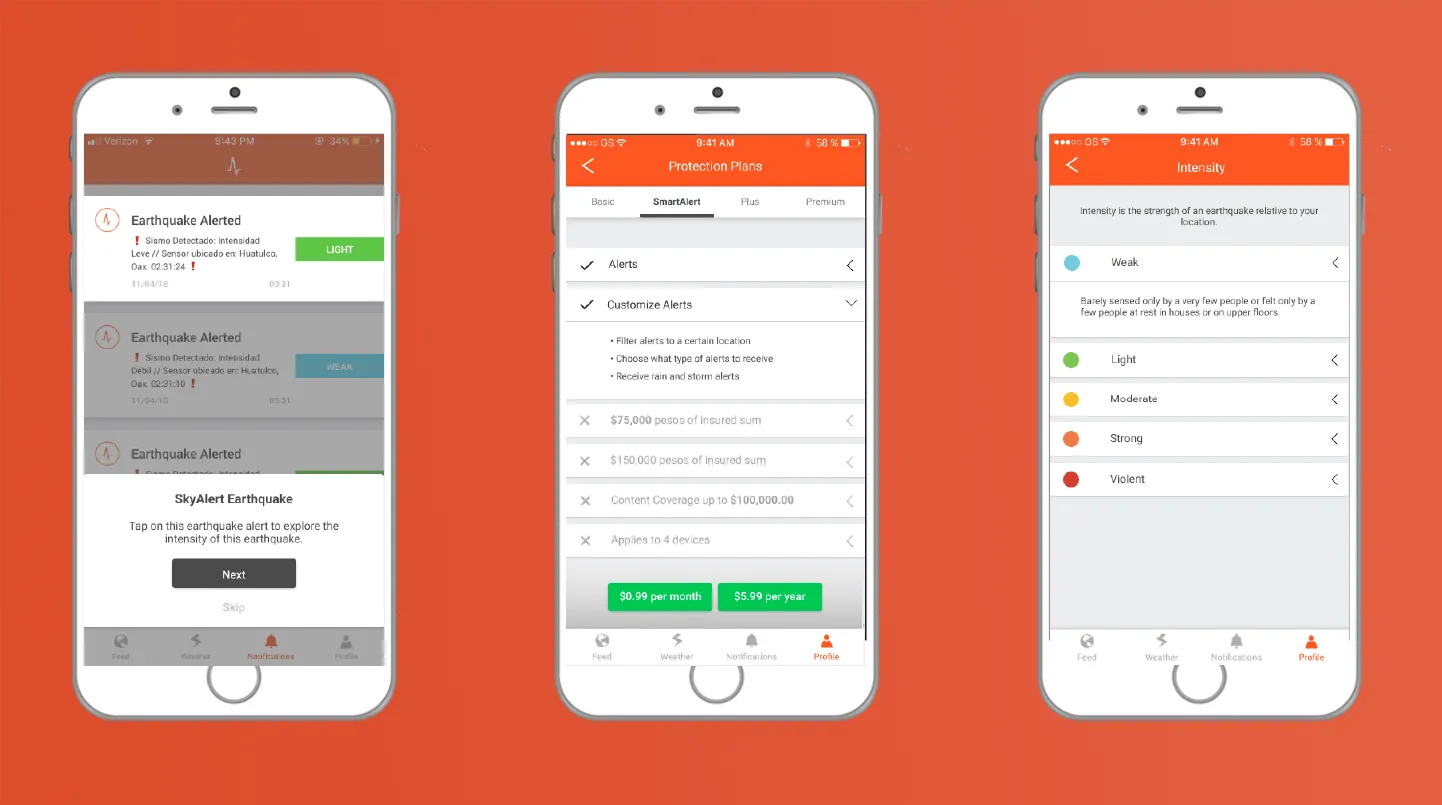
Three iPhone mockups of the SkyAlert app on an orange background: an earthquake alert with a walkthrough prompt, a Protection Plans screen, and an Intensity scale

01Problem

SkyAlert is an early earthquake warning system that tells you about an earthquake before you feel it. Four of us on the design team (Monica, Warren, Bhushan and me) were asked to make an onboarding flow that explains the existing mobile app, its features, its technology and its subscription options.

Audience: SkyAlert started in Mexico City and has a Spanish-speaking user base in Mexico. They wanted to grow in California, where earthquakes are a worry too.

02Research
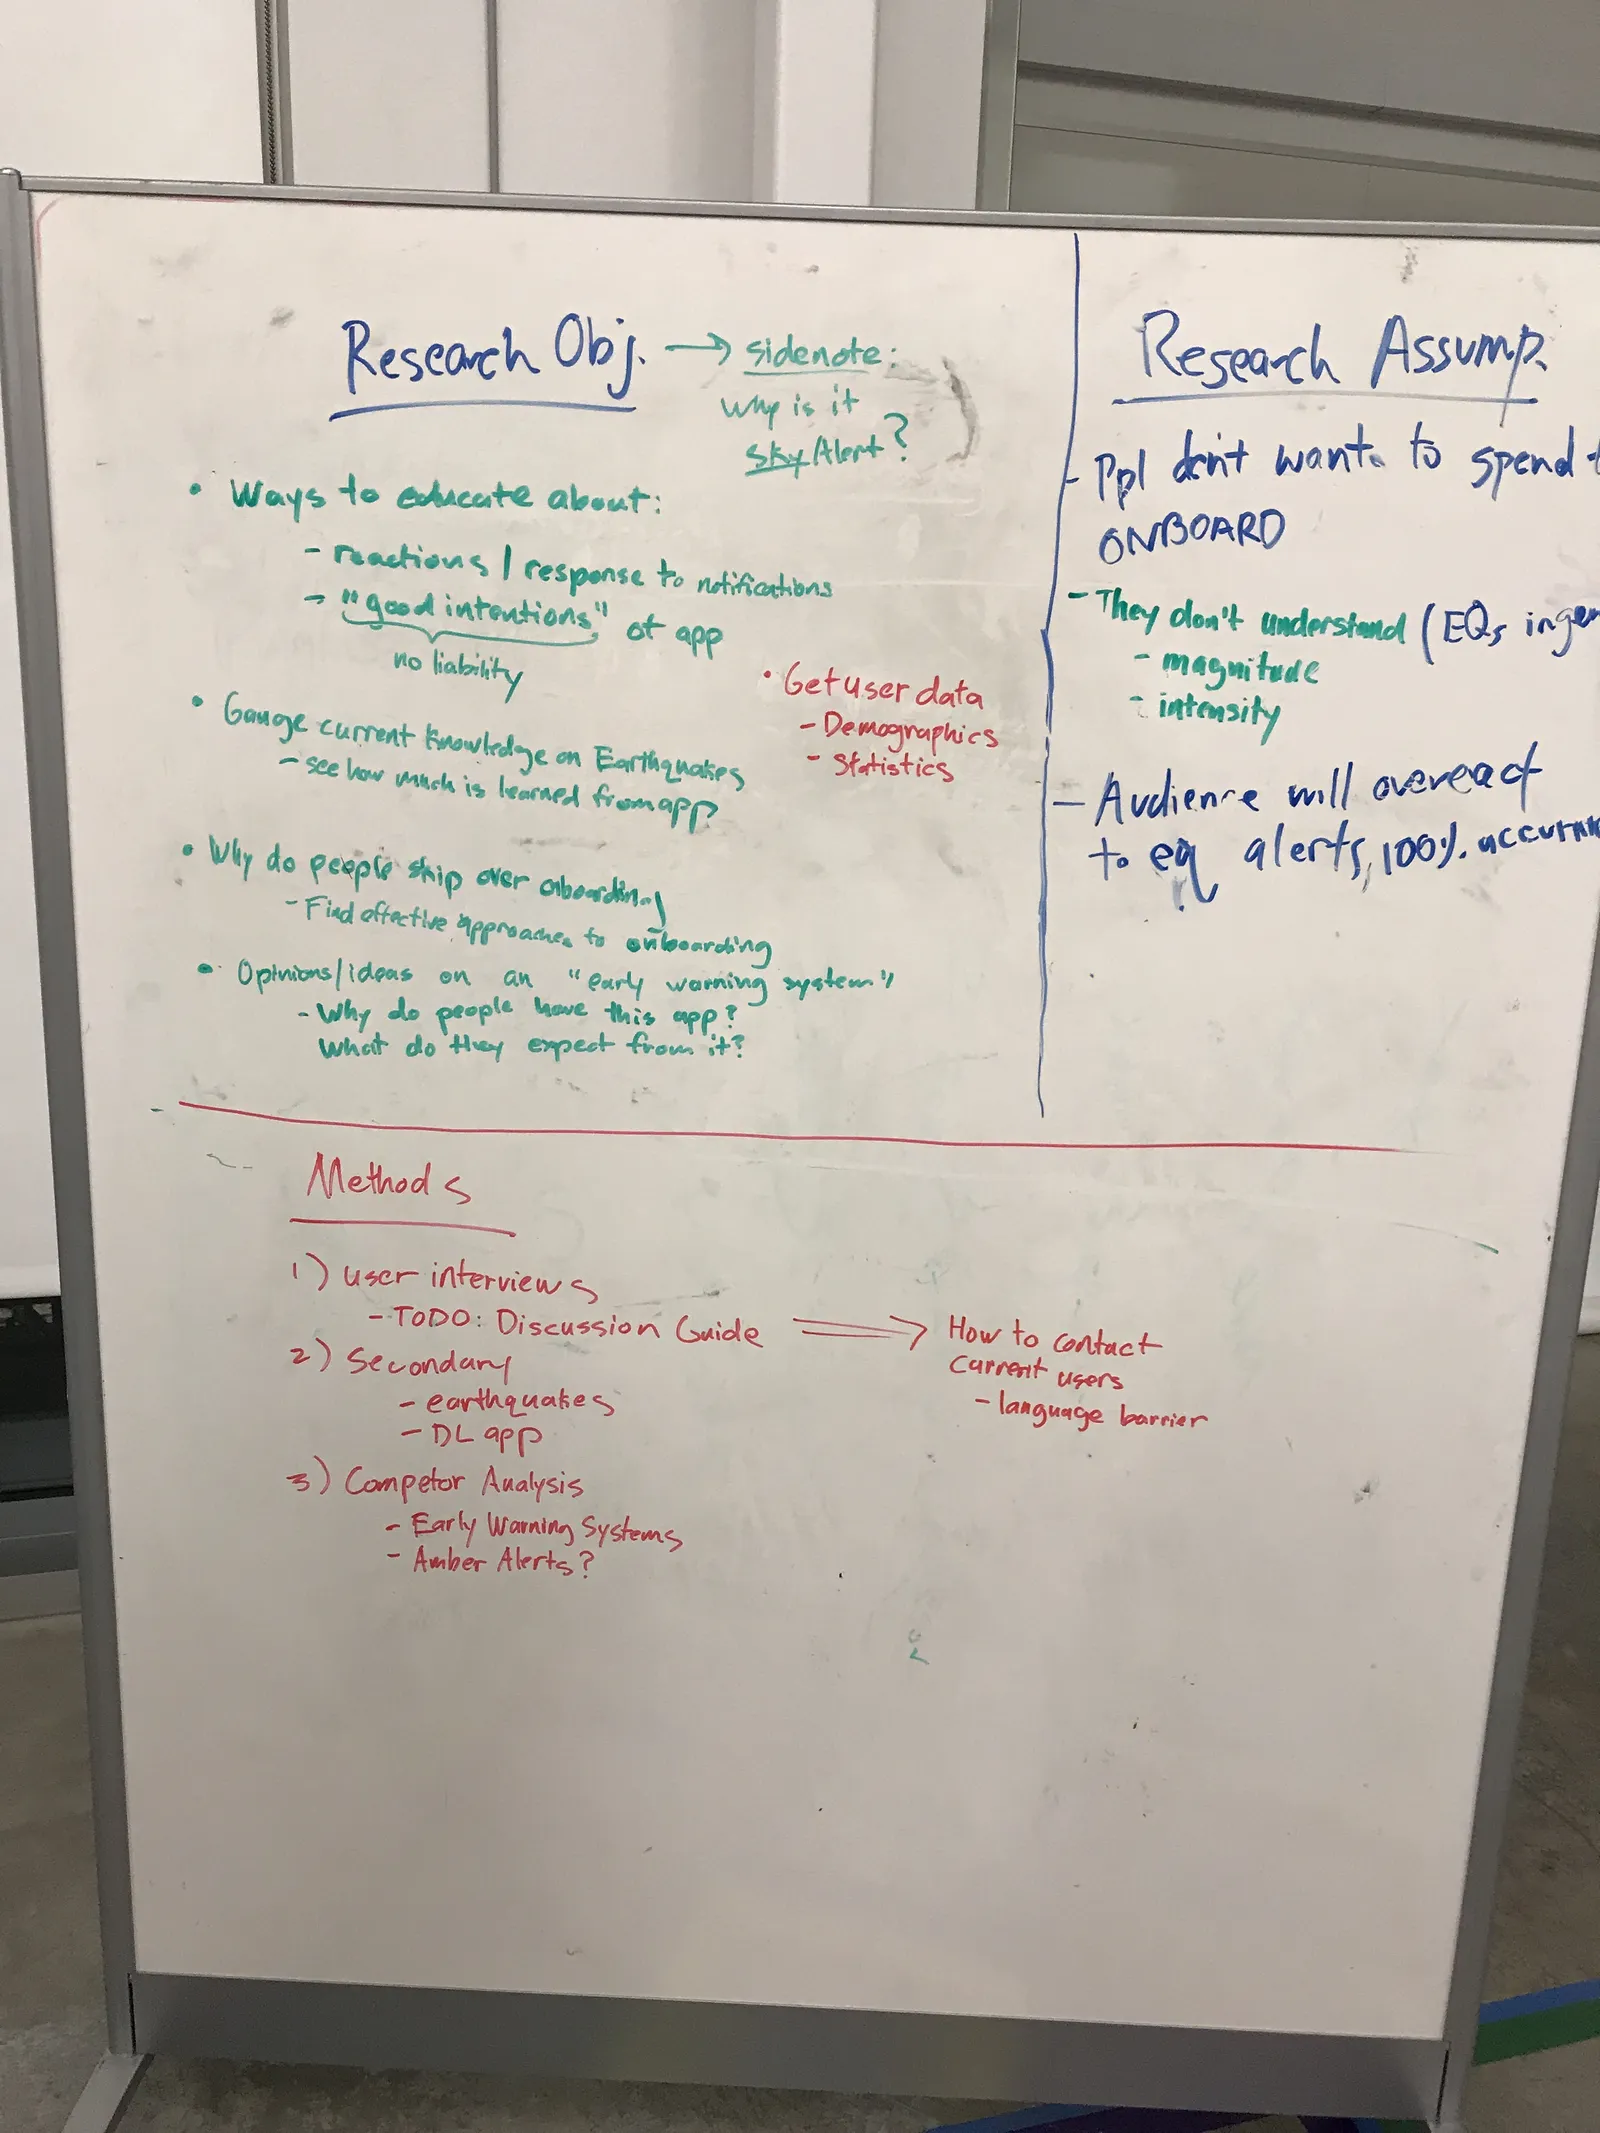
A whiteboard with research objectives in green, research assumptions in blue on the right, and a list of methods in red below: user interviews, secondary research and competitor analysis
Our research plan: what we wanted to learn, what we assumed, and how we’d find out.

Survey

We sent a survey out through SkyAlert’s Twitter and got 5,501 responses in one day. Most of their users are in Mexico, so we translated it into Spanish. A few of the questions in the Google form:

  • Why do you have this application?
  • How often do you open this app?
  • In your own words, what is the purpose of SkyAlert?
  • Have you watched the tutorial video on the app? Why or why not?
  • Do you know how SkyAlert’s earthquake detection technology works?
  • On a scale from 1 to 5 (1 easiest, 5 hardest), how hard is the app to use?

Here is the age breakdown of the responses, in years.
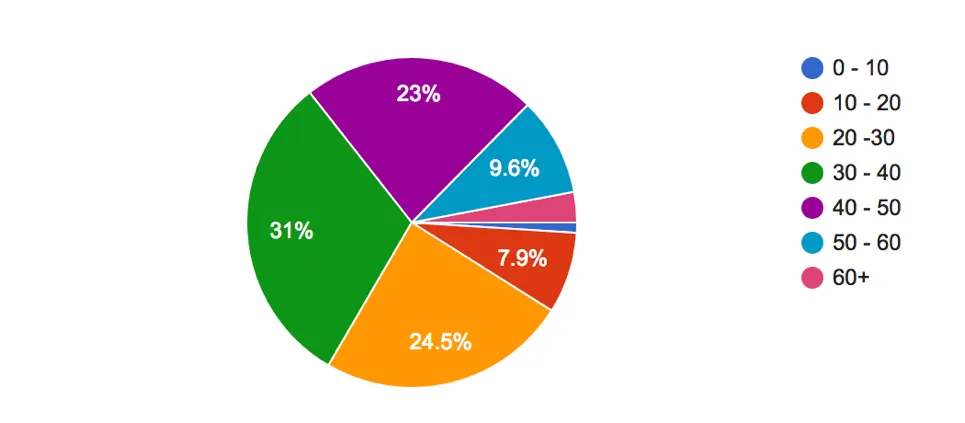
A pie chart of survey respondents by age: 31% are 30 to 40, 24.5% are 20 to 30, 23% are 40 to 50, 9.6% are 50 to 60, 7.9% are 10 to 20, and small slices for 60 plus and 0 to 10
Most respondents were between 20 and 50.

User interviews

We also interviewed 6 college students in California. Our discussion guide asked what they knew about earthquakes and early warning systems, and about mobile onboarding.

User testing the current app

We tested the latest version of the app with two Spanish-speaking users, since it was still only in Spanish. Here is our testing guide. We wanted to:

  • See how well the current onboarding works
  • See how people move through the app
  • Find the existing pain points

03Synthesis and insights

We put everything we learned into Trello and affinity mapped it.
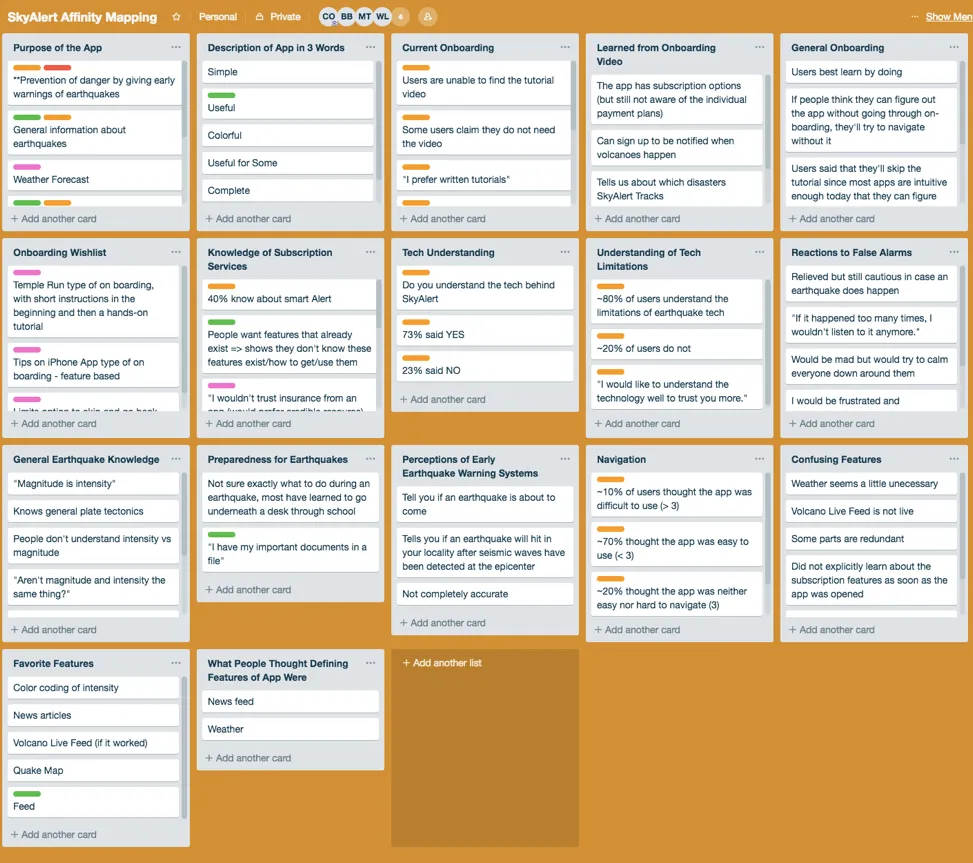
A Trello board with lists of research notes, including Purpose of the App, Current Onboarding, Knowledge of Subscription Services, Tech Understanding, Navigation, Confusing Features and Favorite Features
Our affinity map in Trello.

A few things stood out.

Purpose

  • Users described the app as prevention, preparation and education, and said they had it for security.
  • From our contextual inquiry, the purpose may not come across to new users, especially if they skip onboarding.

Onboarding

50% of people hadn’t seen the onboarding video.
  • They didn’t have time
  • They preferred written tutorials
  • It wasn’t hands-on
  • They didn’t think it was necessary

Subscriptions

  • 40% of users knew about SmartAlert, one of the plans.
  • The insurance subscription didn’t feel credible: “I wouldn’t trust insurance from an app.”
  • Many people didn’t know the subscription options existed.

Earthquake knowledge

  • Users didn’t understand the difference between magnitude and intensity.

Personas

With that data we made 3 personas to focus our ideas.
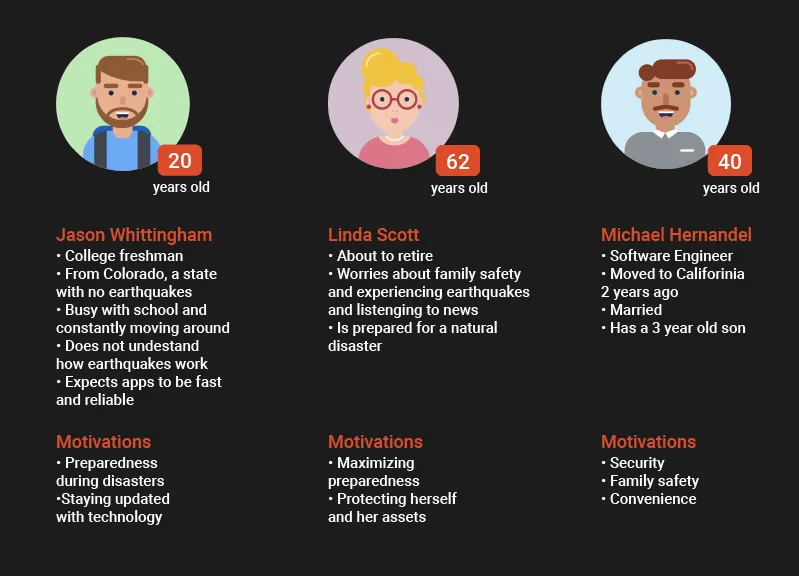
Three personas on a dark background: Jason, a 20-year-old college freshman from Colorado; Linda, 62, about to retire; and Michael, 40, a software engineer with a young son, each with their motivations
Jason, Linda and Michael.

04Ideation

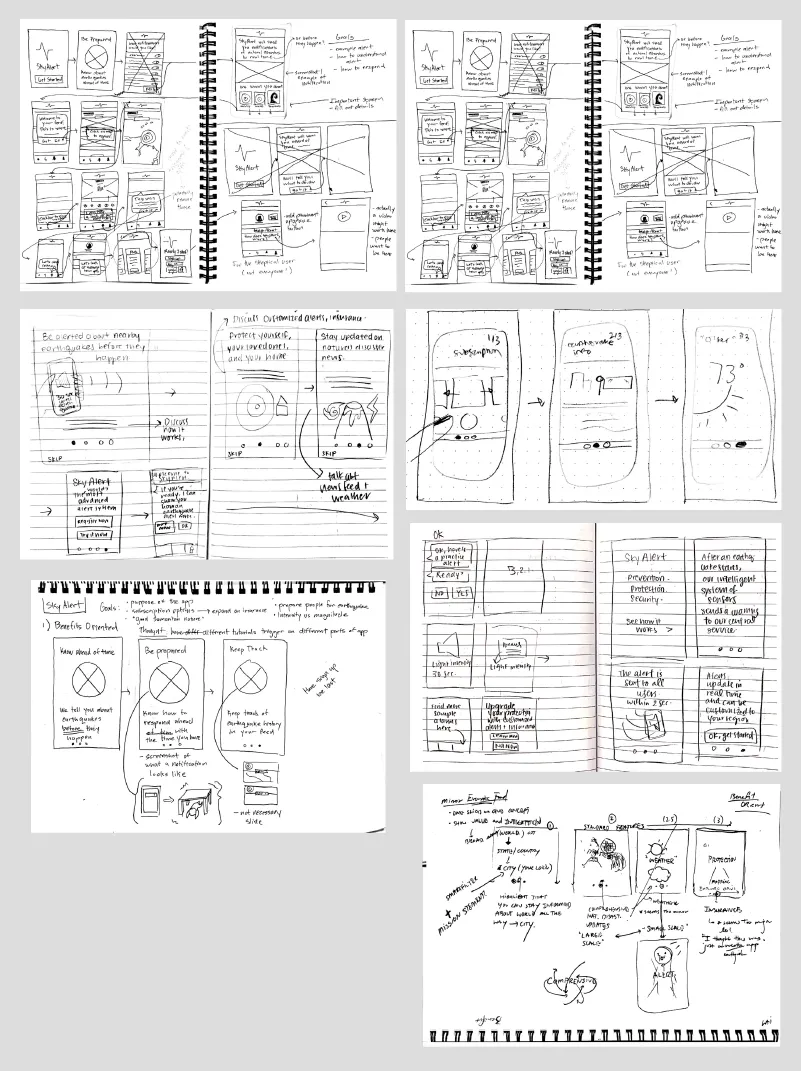
With the research in mind, we sketched ideas for the onboarding.
Pages of notebook sketches of onboarding screens: a benefits carousel, tutorial prompts over the feed, and notes on goals like explaining how it works and subscription options
Our onboarding sketches.

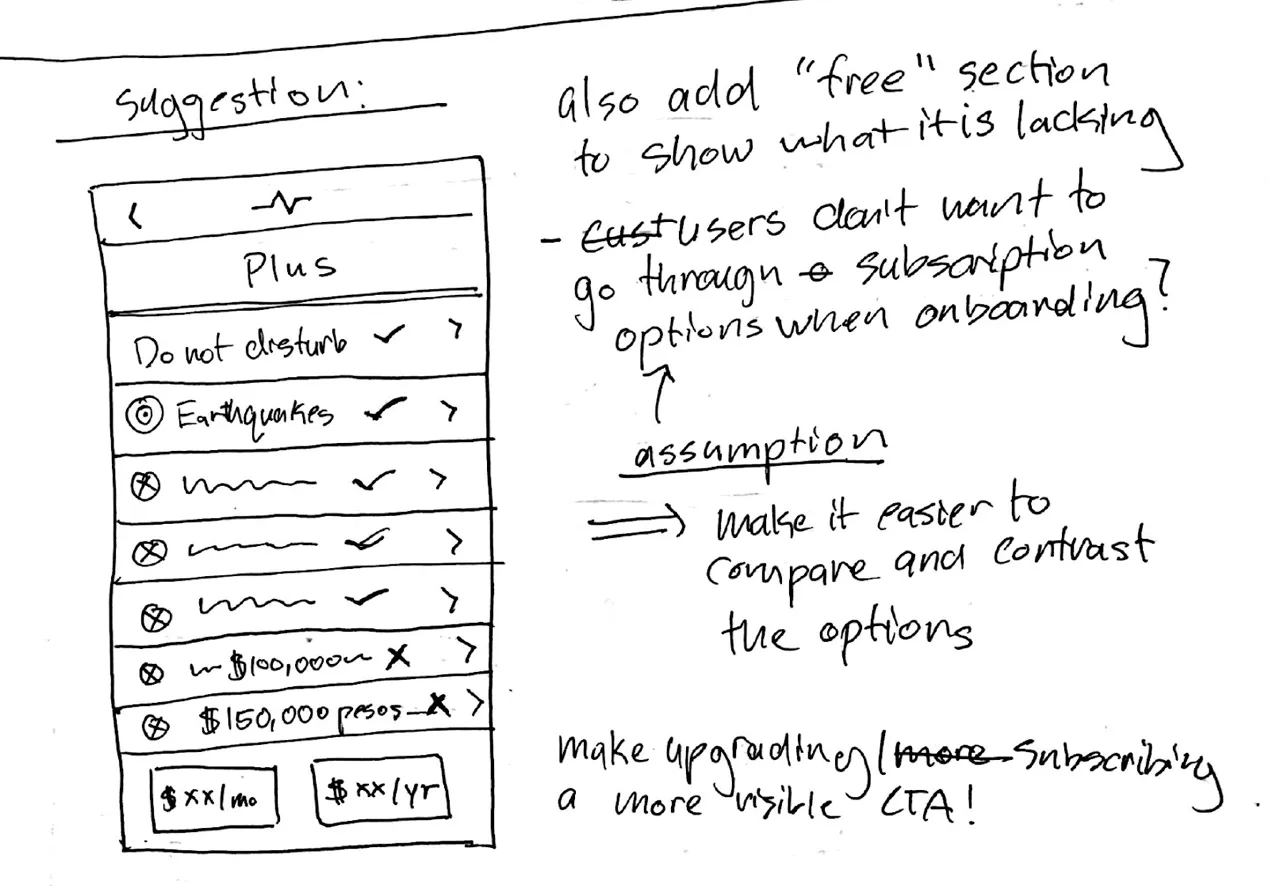
We also went outside our scope and redesigned the subscription plan pages, to make the options easier to understand and compare.
A hand-drawn plan screen for the Plus plan with a checklist of features, and handwritten notes: add a free section to show what it is lacking, and make upgrading a more visible call to action
Our idea for the plans page: a clear checklist of what each plan has, and an obvious way to upgrade.

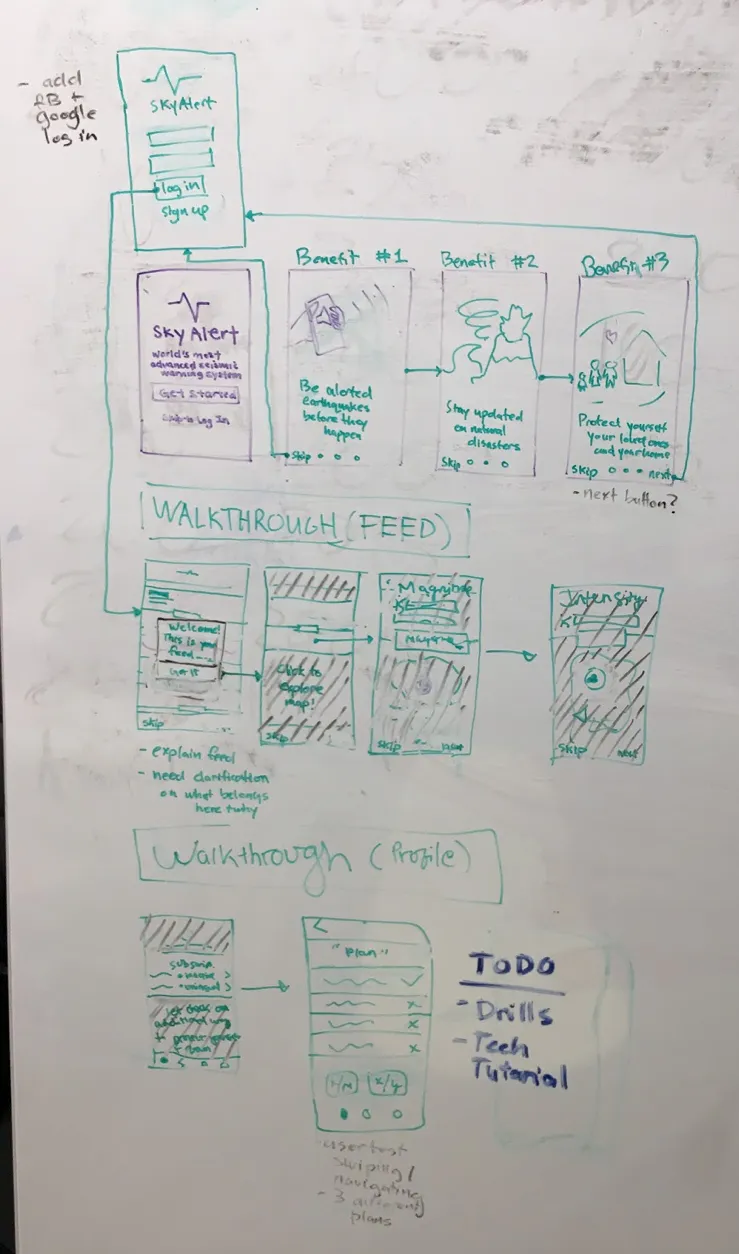
Then we pulled it together into first wireframes. They had:

  • Walkthroughs for the feed and the profile
  • A carousel about the app’s benefits
A whiteboard flow: a welcome screen and login, three benefit screens, a four-step feed walkthrough, and a profile walkthrough ending at the plans screen, with a to-do list for drills and a tech tutorial
The first flow on the whiteboard.

05Mid-fi

We took the low-fi wireframes and redrew them in Figma.

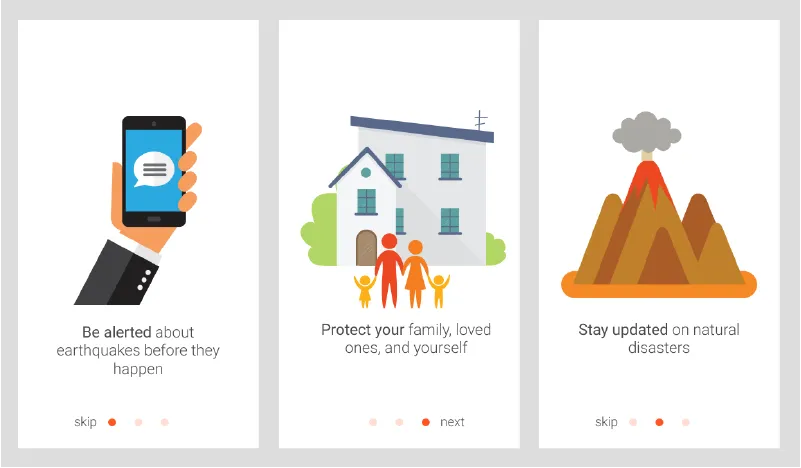
Benefits carousel
Three carousel screens: a hand holding a phone with an alert, a house with a family, and a volcano, each with a short line of text and skip or next
The graphics are stock for now.

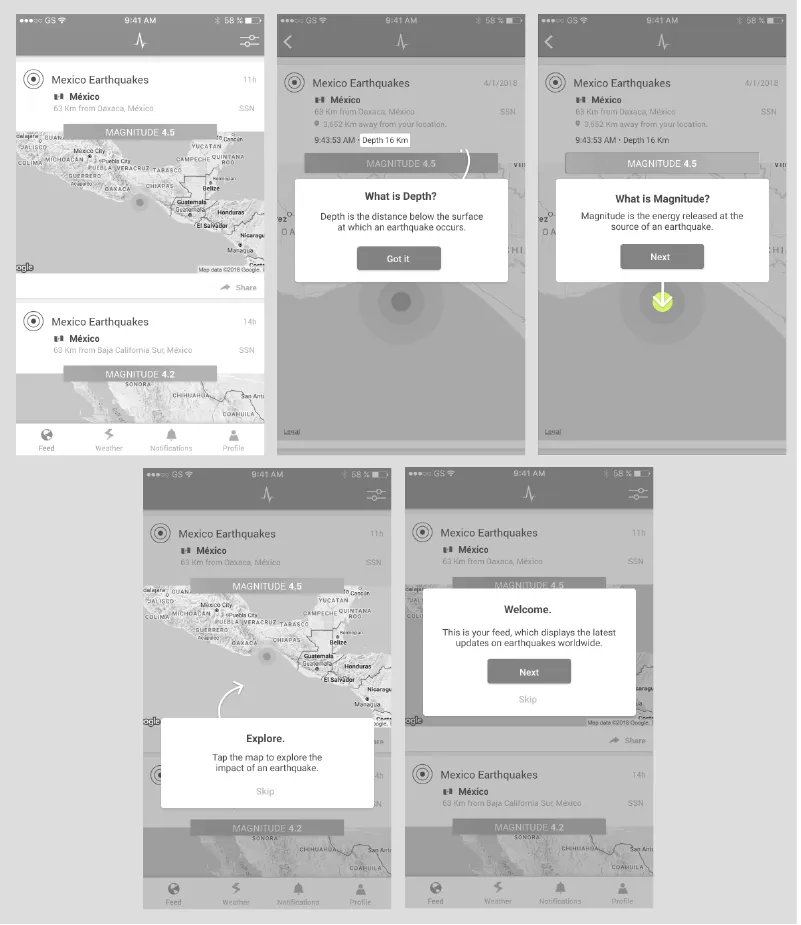
Feed walkthrough

Five grayscale screens of the earthquake feed with pop-ups explaining the feed, the map, depth and magnitude
Pop-ups that explain the feed, the map, depth and magnitude as you go.

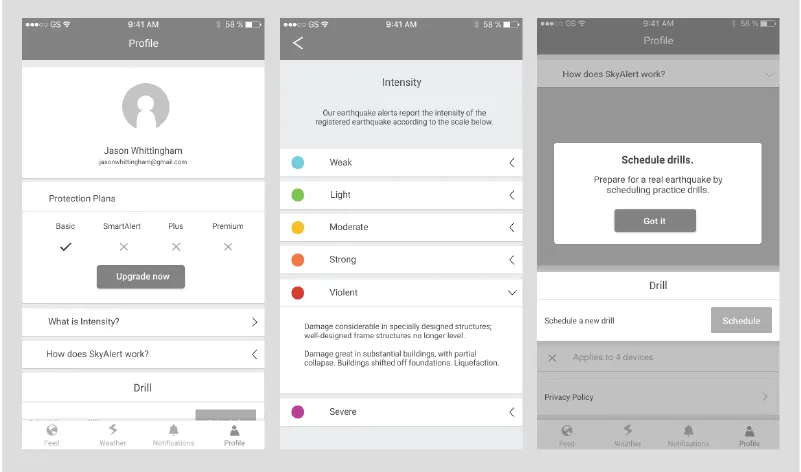
Profile, intensity and drills

Three grayscale screens: a profile with protection plans, an intensity scale from weak to violent, and a pop-up about scheduling drills
The profile, the intensity scale, and a prompt for scheduling drills.

06User testing

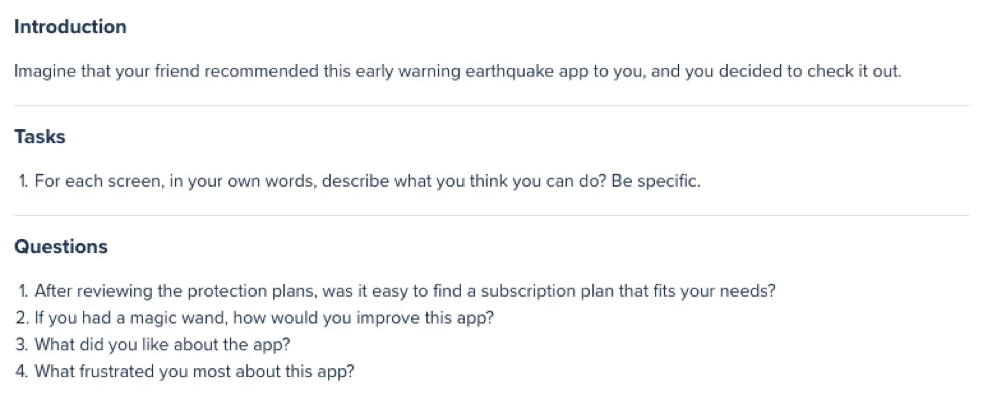
We used our mid-fi mockups, UserTesting.com and InVision to test with 12 people. UserTesting.com let us choose age groups, so we picked three: 18 to 30, 30 to 50 and 50 and up. This was our prompt.
The test prompt: imagine a friend recommended this early warning earthquake app. One task, to describe what you can do on each screen, then four questions about the protection plans, what they would improve, what they liked and what frustrated them
The prompt we gave testers.

And some of the feedback we worked into the designs:
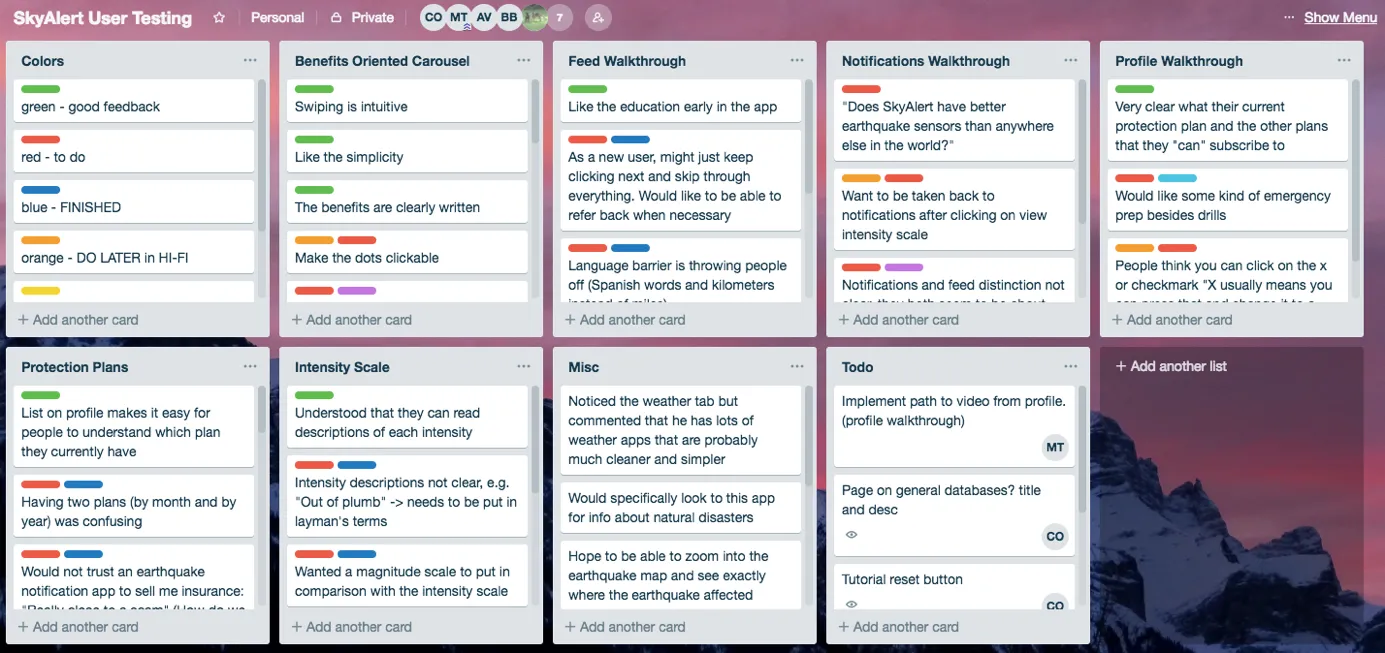
A Trello board of user testing feedback sorted by screen: benefits carousel, feed walkthrough, notifications, profile, protection plans and intensity scale, with color labels for good feedback, to do, finished and do later
Feedback sorted by screen. Green was good news, red was something to fix.

07Hi-fi

We made changes from there and put together the final screens.
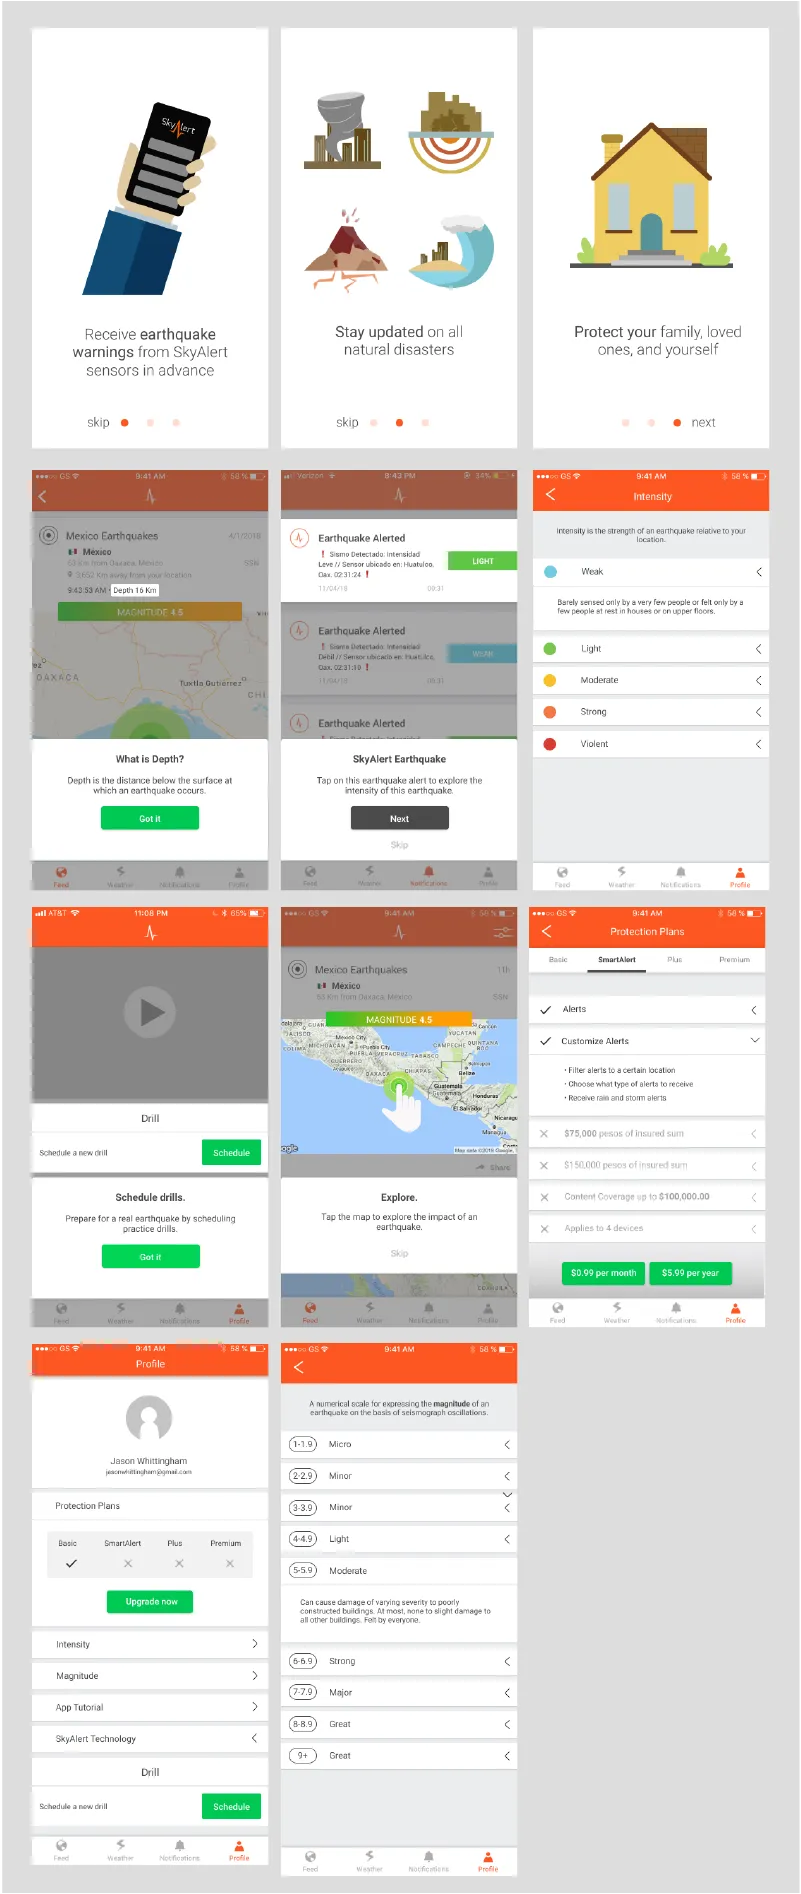
Final screens: three benefit carousel screens, the feed with a depth explainer and an alert walkthrough, the intensity scale, drills, the map prompt, the Protection Plans screen, a profile with plan checkmarks and a magnitude scale
The final onboarding and the redesigned plans page.

08Takeaways

If you see a place to improve, speak up

Our scope was an onboarding flow, but we thought the subscriptions page could be better too. We had the time, so we asked if we could redo it. It ended up being my favorite part of the project.

Get feedback often

Our client didn’t know much about design, so we leaned on Berkeley Innovation’s own people for critique. That meant showing officers and other project teams our decisions, answering their questions and listening to what they said.